Change by Component name/type/all components
Change management is an integral component of configuration management. In recent times, it has been observed that a majority of performance issues experienced by IT infrastructures are owing to improper / unauthorized changes to configuration. It is therefore essential for administrators to track the configuration changes effected in an IT environment on a regular basis so that, erroneous changes can be promptly identified and rolled back. To enable administrators to efficiently monitor configuration changes and easily view what was changed, when, and by whom, the eG Configuration Management console provides a variety of interfaces. One such page is the CONFIGURATION CHANGE : DETAILED page. This page enables you to query on the configuration management database and retrieve change information that fulfills specified criteria.
This page helps the administrator to understand at a glance the overall configuration changes, that were being effected for a chosen time period across the environment. The vision of this page is broadly classified according to the below listed categories:
- Component Name
- Component Type
- All components
The following implies the significance of each category:
- By choosing component name, you will know what are the changes that were effected for a specific component.
- By choosing component type, you will know what are the changes that were effected across the components of a specific component type.
- By choosing all components, you will know what are the changes effected across the environment.
This page provides a graphical representation and as well as table, illustrating the list of changes that were effected either to a specific component or across the environment according to your preference of choice.
This page can be accessed by the following menu sequence, Changes ->By Criteria -> All Components field.
To view the changes effected on a particular component during a specified timeline using this page, do the following:
- First, select a Component Name from the Change Criteria list box as depicted in Figure 1 . This will invoke Component Name list box. Select a component from the Component Name list box, for which you would like to view the configuration changes.
- For instance, to view the configuration changes for a windows component, select Component Name from the Change criteria list box and select a specific windows based component from the Component Name list box.
- This will invoke a list box called Show changes in, providing a list of options appropriate to the chosen windows component such as software,processor,network adapters etc, for which you would like to view the configuration changes. All the options listed in this list box will be selected by default. You can even choose a specific option from the Show changes in list box, for which you can view the configuration changes for the chosen entry alone.
- Next select a timeperiod from the Timeline list box as depicted in Figure 1. Using this option you can view the configuration changes that were effected on the basis of days, weeks and hours. The maximum duration of period available in this list box is 1 month. If your requirement is not available in this list box, then select Any option from the Timeline list box. This will invoke the calender capability, to which you can select choice of your date using the From and To fields, that are available.
- To view the recent changes alone, select Recent changes from the Show field. To view all the changes appropriate to the chosen time period, select All changes from the Show field.
- To view the output of the configuration changes on the basis of dates appropriate to the chosen time period, select Date option from the Arrange changes by field. This will invoke Changes per page list box, which allows you to choose the number of changes to be displayed per page.
- Selecting Information option from the Arrange changes by field, will provide configuration change details arranged explicitly according to the chosen options from the Show changes in list box.
-
Finally, click the SUBMIT button ( see Figure 1).
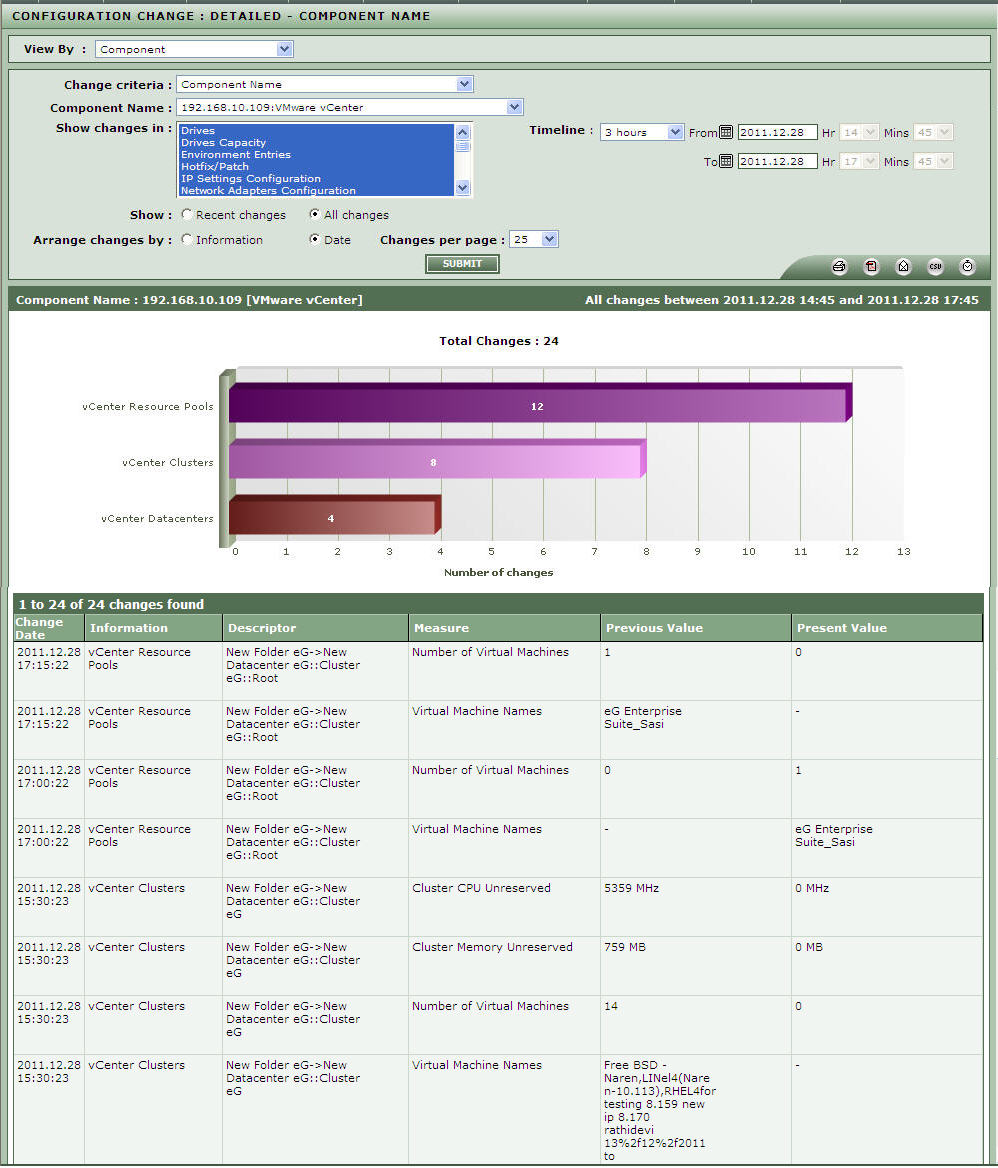
Figure 1 : Viewing configuration changes for a specific component
- This will provide a graph, depicting the number of changes that were effected for each available options, selected from the Show changes in list box specific to a component.
- Besides, it also provides a table which concisely explain the configuration changes, that were effected for the chosen component, for which the output of the table is displayed according to the option chosen from the Arrange changes by field. This table will indicate the Descriptor that has changed, the Measure for which the value changed, the Previous Value of the measure, the Present Value of the measure, and the Change Date.
To view the configuration changes for a specific component type for a specified time period, do the following:
- Select Component Type from the Change criteria list box as depicted in Figure 2. This will invoke Component Type list box. Select a component type from the Component Type list box, for which you would like to view the configuration changes.
- For instance to view the configuration changes for a specific component type say as Linux, select Component Type from the Change criteria list box and select Linux from the Component Type list box.
- This will invoke a list box called Show changes in, providing a list of options appropriate to the chosen Linux component type such as software, processor, network adapters, IPC shared memory, stream tunable etc for which you would like to view the configuration changes. All the options listed in this list box will be selected by default. You can even choose a specific option from the Show changes in list box, for which you can view the configuration changes for the chosen entry alone.
- Next select a timeperiod from the Timeline list box as depicted in Figure 2. Using this option, you can view the configuration changes that were effected on the basis of days, weeks and hours. The maximum duration of period available in this list box is 1 month. If your requirement is not available in this list box, then select Any option from the Timeline list box. This will invoke the calender capability to which, you can select choice of your date using the From and To fields that are available.
- To view the recent changes alone, select Recent changes from the Show field. To view all the changes appropriate to the chosen time period, select All changes from the Show field.
- To view the output of the configuration changes on the basis of dates appropriate to the chosen time period, select Date option from the Arrange changes by field. This will invoke Changes per page list box, which allows you to choose the number of changes to be displayed per page.
- Selecting Information option from the Arrange changes by field, will provide configuration change details arranged explicitly according to the chosen options from the Show changes in list box.
-
Finally, click the SUBMIT button ( see Figure 2).
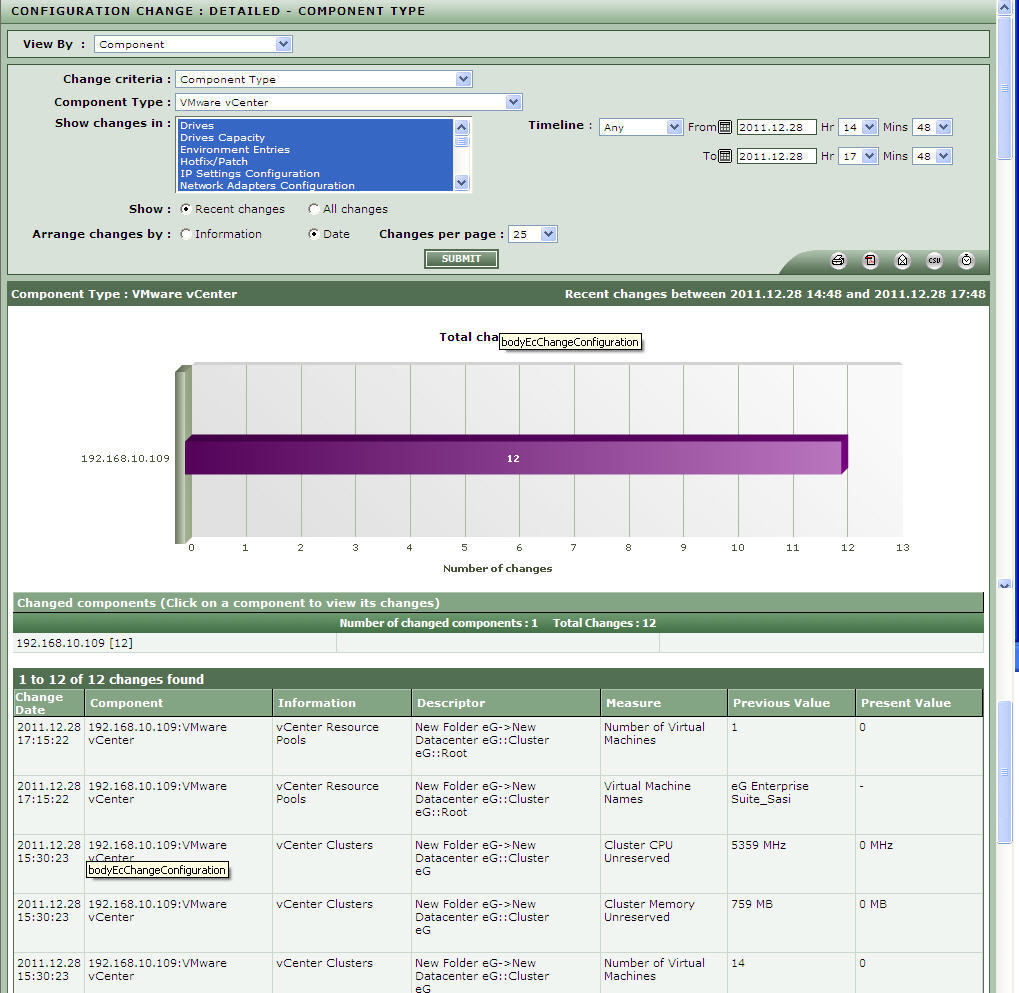
Figure 2 : Viewing configuration changes for a specific component type
- A graph depicting the top-5 (by default) components of the chosen type, which have undergone the maximum number of changes during the specified timeline and a table listing the components that were effected with number of changes specific to a component type. Clicking on any of the listed components, will take you to a page, which specifically depicts with a graph and a table listing the configuration changes that were effected for the chosen component alone.
-
Besides, it also provides a table in the CONFIGURATION CHANGE : DETAILED page, which concisely explain the configuration changes that were effected for a specific component type for which the output of the table is displayed according to the option chosen from the Arrange changes by field.
In this page you will find the following sections:
- a Changed components section that simply lists the changed components of the chosen type and the number of changes made per component; clicking on a component here will lead you to a page that provides detailed change information pertaining to that component, in a graphical and a tabular format;
- a separate section for each of the changed components; this section will provide a graph revealing the top-5 configuration parameters of that component, in terms of the number of changes effected on them during the defined timeline; this will be followed by a series of tables - one each for every changed configuration parameter - that reveals the Descriptor that has changed, the Measure for which the value changed, the Previous Value of the measure, the Present Value of the measure, and the Change Date.
To view the configuration changes that were effected across the environment:
- Select All Components from the Change criteria list box as depicted in Figure 3.
- This will invoke a list box called Show changes in, providing a list of options that are appropriate across the environment such as software, processor, network adapters etc for which you would like to view the configuration changes. All the options listed in this list box will be selected by default. You can even choose a specific option from the Show changes in list box, for which you can view the configuration changes for the chosen entry alone.
- Next select a timeperiod from the Timeline list box as depicted in Figure 3. Using this option, you can view the configuration changes that were effected on the basis of days, weeks and hours. The maximum duration of period available in this list box is 1 month. If your requirement is not available in this list box, then select Any option from the Timeline list box. This will invoke the calender capability, to which you can select choice of your date using the From and To fields that are available.
- To view the recent changes alone, select Recent changes from the Show field. To view all the changes appropriate to the chosen time period, select All changes from the Show field.
- To view the output of the configuration changes on the basis of dates appropriate to the chosen time period, select Date option from the Arrange changes by field. This will invoke Changes per page list box, which allows you to choose the number of changes to be displayed per page.
- Selecting Information option from the Arrange changes by field will provide configuration change details arranged explicitly according to the chosen options from the Show changes in list box.
-
Finally, click the SUBMIT button( see Figure 3).
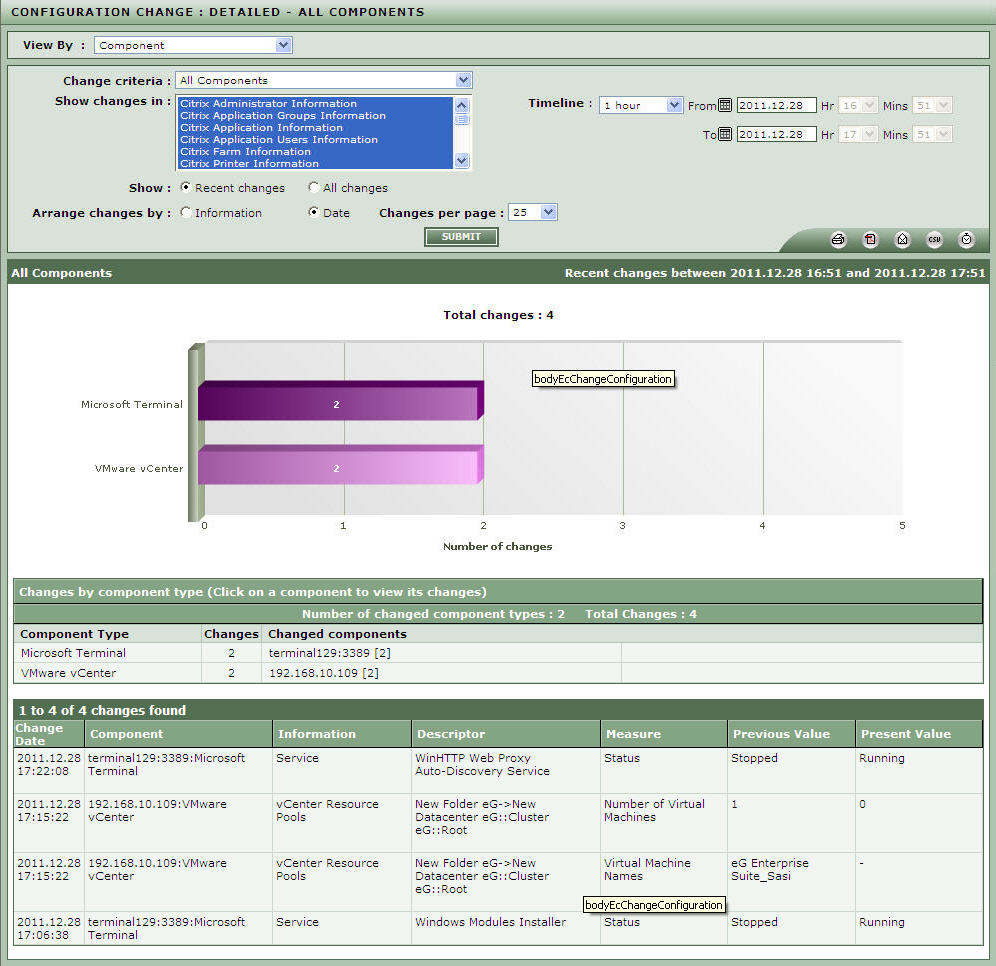
Figure 3 : Viewing configuration changes across the components
- A graph depicting the top-5 (by default) component-types, which have undergone the maximum number of changes during the specified timeline and a table listing the component types with its respective components that were effected with configuration changes for the chosen time period. Clicking on any of the listed components, will take you to a page, which specifically depicts with a graph and a table listing the configuration changes that were effected for the chosen component alone.
-
Besides, it also provides a table in the CONFIGURATION CHANGE : DETAILED page, which concisely explain the configuration changes that were effected across the environment for which the output of the table is displayed according to the option chosen from the Arrange changes by field.
In this page you will find the following sections:
- a Changes by component-type section that simply lists all the changed component-types, the changed components per type, and the number of changes made per component; clicking on a component here will lead you to a page that provides detailed change information pertaining to that component, in a graphical and a tabular format;
- a separate section for each of the changed components; this section will provide a graph revealing the top-5 configuration parameters of that component, in terms of the number of changes effected on them during the defined timeline; this will be followed by a series of tables - one each for every changed configuration parameter - that reveals the Descriptor that has changed, the Measure for which the value changed, the Previous Value of the measure, the Present Value of the measure, and the Change Date.
Note:
By default, all the graphs displayed in this page reveal the top-5 components / component-types / configuration parameters (as the case may be), in terms of the number of changes that were effected on them during the given timeline. If need be, you can override this default setting so that, the graph reveals more or less number of elements - for instance, you can configure the graph to display the top-10 components / component-types / configuration parameters, instead of top-5. To achieve this, do the following:
- Edit the eg_configtests.ini file in the {EG_INSTALL_DIR}\manager\config directory.
- In the [CONFIGURATION_CHANGE] section of this file, change the default value of the TopN parameter to reflect any value of your preference; in the case of the above example, change the default value '5' to '10'.
- Finally, save the file.