The Overview Page
The first page that will be displayed on logging into the eG administrative interface is the Overview page (see Figure 3).
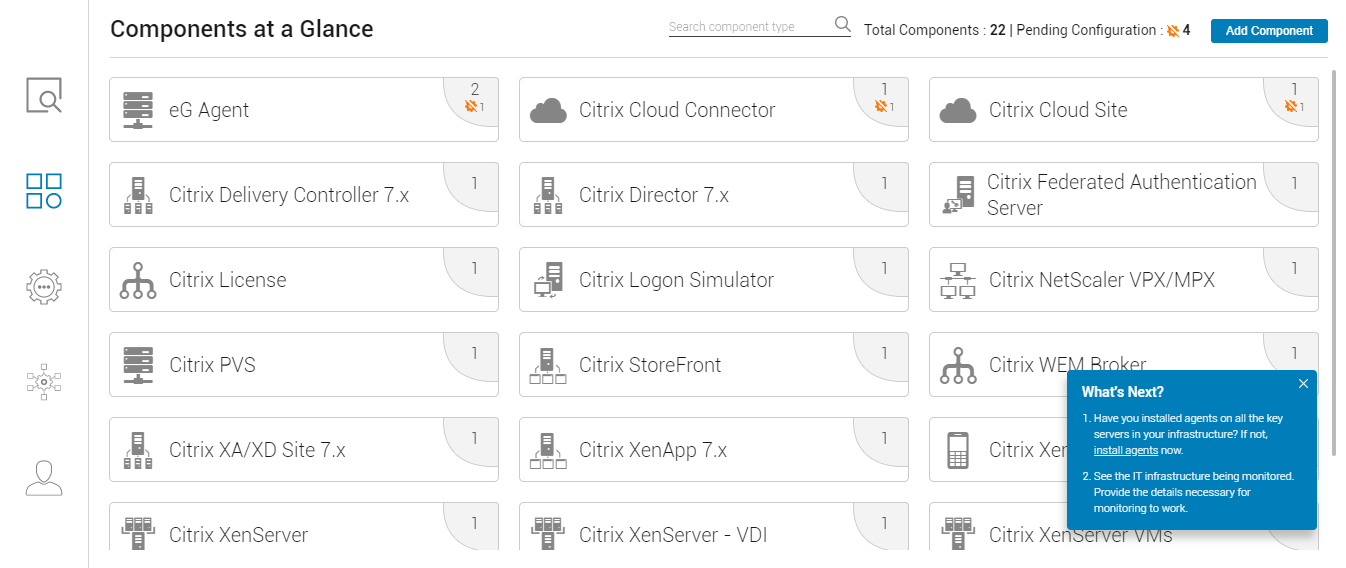
Figure 3 : The Components at a Glance section of the Overview page
Each of the sections of the Overview page are discussed elaborately in this topic.
Components at a Glance
By default, the Components at a Glance section opens (see Figure 3). This section provides a quick summary of components currently monitored and those pending configuration. You can look below the summary to view a component type-wise break-up of the count of managed components. You can move your mouse pointer over a component type to know how many components of that type have tests that are yet to be configured (as depicted by Figure 4).
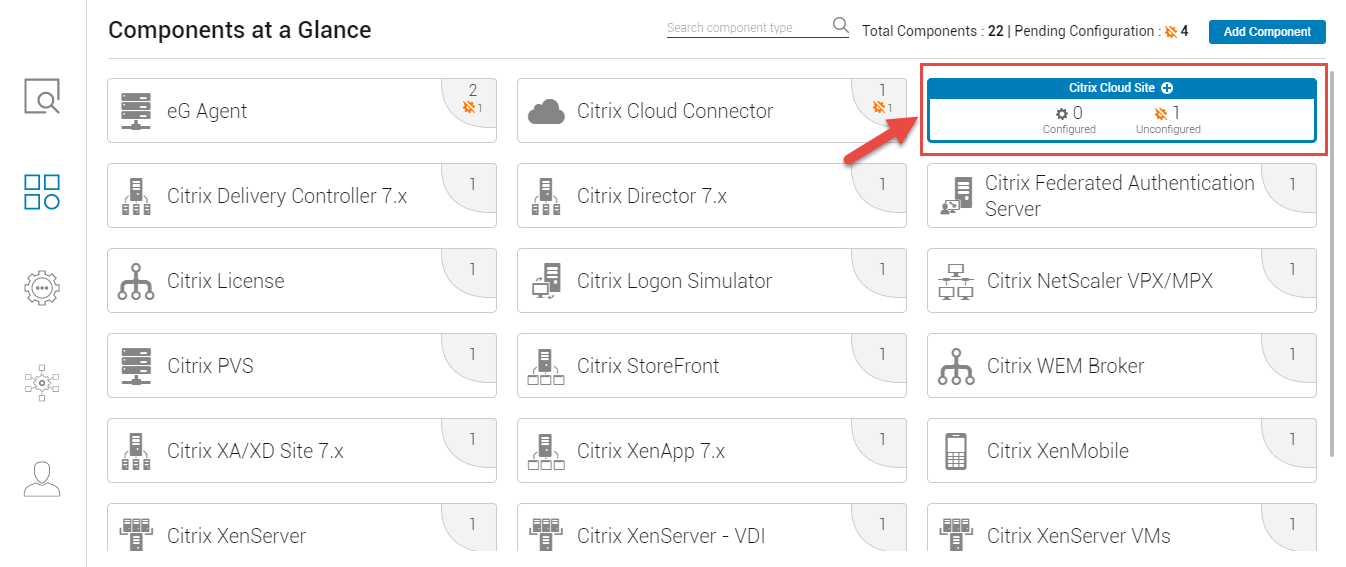
Figure 4 : The count of configured and unconfigured components of a type displayed when hovering a mouse pointer over a component type
To know which components of a type are pending configuration, click on the Unconfigured components count indicated by Figure 4. Figure 5 will then appear displaying the components for which tests are to be configured.
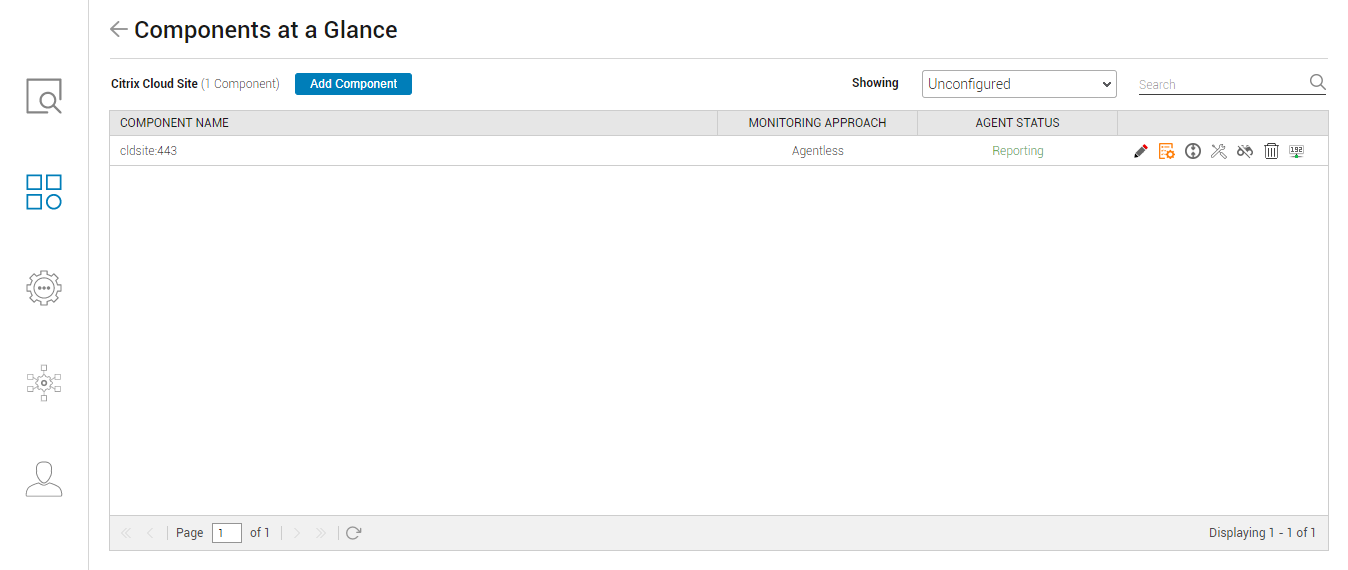
Figure 5 : List of unconfigured components of a type
You can use the tools available alongside the component in Figure 5 to configure the component fully and ready it for monitoring.
You can also use the Add Component button in Figure 3 to add a new component for monitoring.
At any given point in time you can click on the <- button that prefixes the section label Components at a Glance to return to the Components at a Glance view (see Figure 3).
Note that if you are logging into the eG admin interface for the first time after installation, then the Components at a Glance section will not display any components. This is because, no components are managed yet in the environment. To guide you step-by-step through the process of readying your environment for monitoring, the Overview page provides useful, interactive tips. These tips are available in the form of postit-like notes titled 'What's Next', at the bottom, right corner of the Overview page (as indicated by Figure 6).
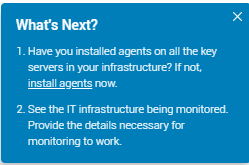
Figure 6 : What's next postit-like note
For instance, when you login to the eG admin interface for the first time, this note will prompt you to begin monitoring by installing agents. Clicking on the install agents link in the note will invoke a set of steps that will explain how you can go from downloading agents from the eG admin interface itself to having your environment automatically discovered and managed (see Figure 7).
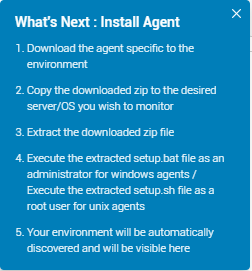
Figure 7 : Instructions for downloading agents, installing them, and having the environment automatically discovered and managed
Discover/Monitor the Environment
To have the components in your environment discovered and monitored, click the Discover/Monitor  icon in the left panel of the Overview page. Figure 8 will then appear.
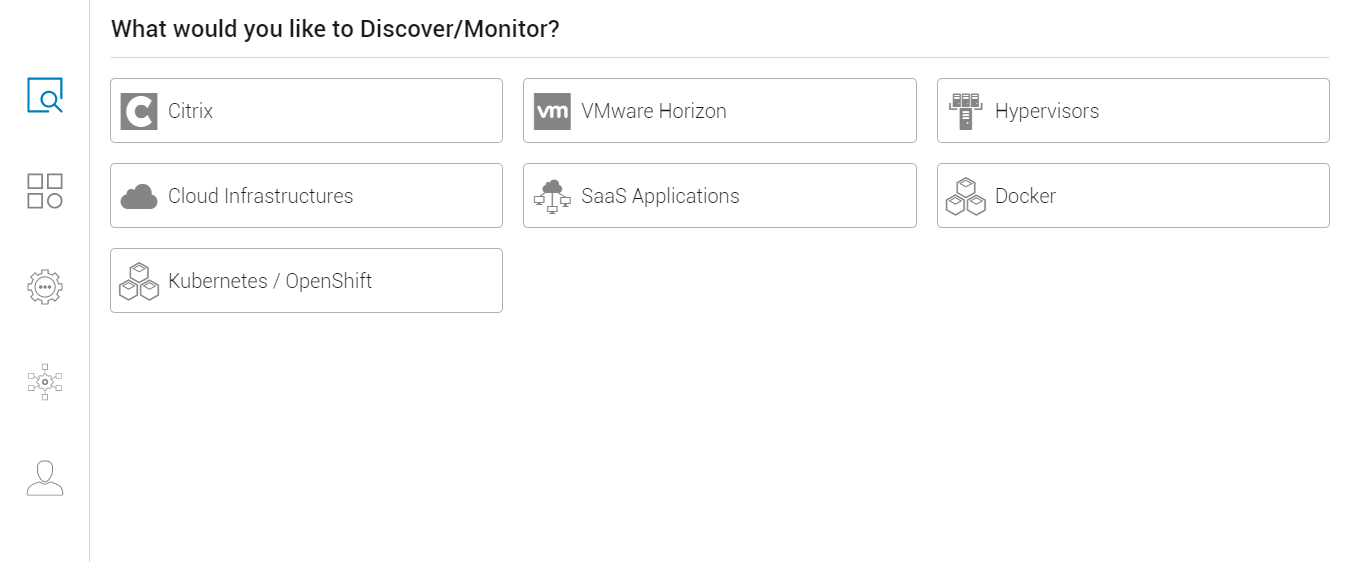
Figure 8 : Discovering/monitoring the environment
The different environments that eG Enterprise is capable of auto-discovering will be listed in the What would you like to Discover/Monitor? page (see Figure 8) that then appears. Click on the option that best describes your infrastructure. For instance, click on the Citrix option in Figure 8 if you want a Citrix infrastructure monitored. In this case, Figure 9 will then appear.
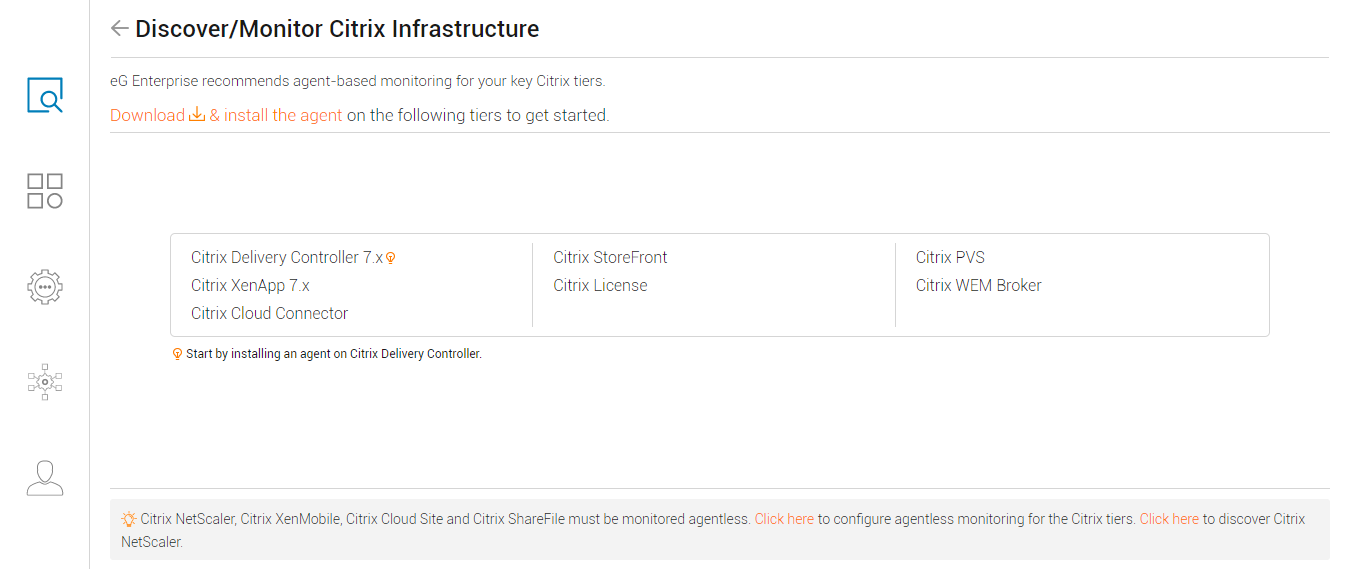
Figure 9 : Citrix tiers that eG Enterprise monitors out-of-the-box
Figure 9 that then appears lists the key Citrix tiers. You can install an eG agent on any of the listed tiers to monitor that tier. Alternatively, you can install an eG agent on the Citrix Delivery Controller, so you can automatically discover the entire Citrix infrastructure end-to-end. You will find such useful tips/recommendations strewn all over Figure 9, so you can configure your environment without any assistance!
To install an eG agent on any of the components displayed in Figure 9, click on the Download & install the agent link in Figure 9. All the eG agent packages relevant to the components displayed in Figure 9 will then appear (see Figure 10).
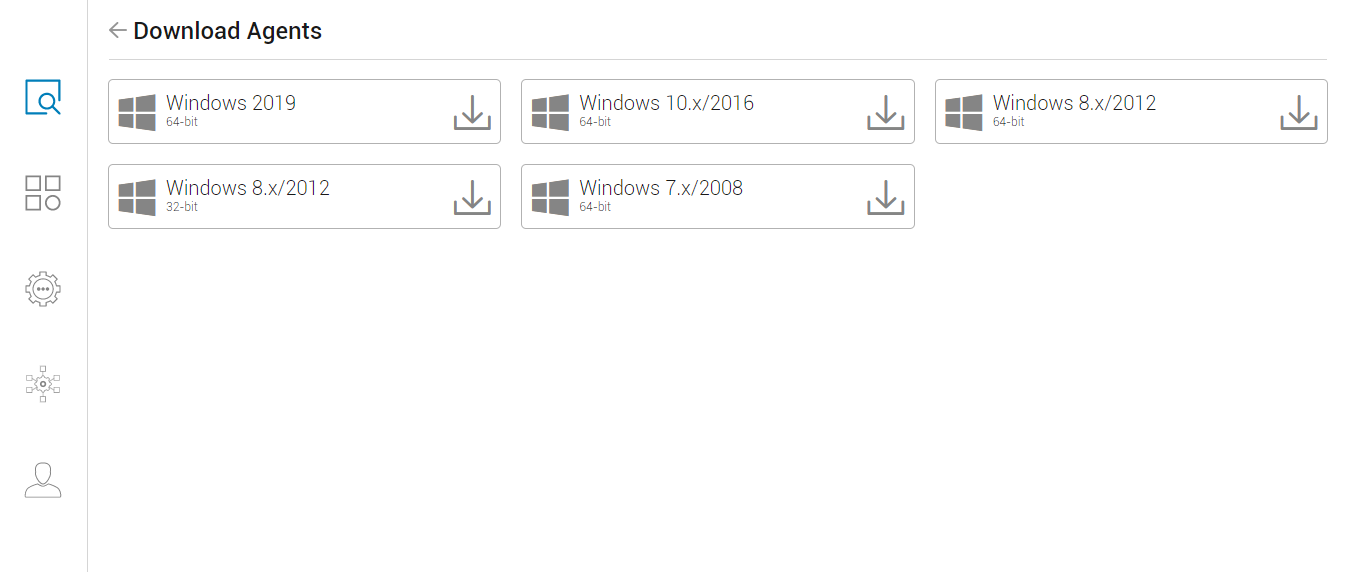
Figure 10 : Installing an eG agent
Click on the eG agent installable of interest to you in Figure 10 to download it. Then, proceed to install the eG agent by following the instructions provided in the eG Installation Guide.
Note:
Figure 10 will be populated with eG agent installables only if these installables are already uploaded to the eG manager. Refer to the eG Installation Guide to know how to upload the eG agent installables to the eG manager.
If there are components in the chosen infrastructure that can only be monitored in an agentless manner, then such components will be highlighted at the bottom of Figure 9. To configure agentless monitoring for those components, click on the first Click here link you see at the bottom of Figure 9. Figure 11 will then appear listing the remote agents that pre-exist.
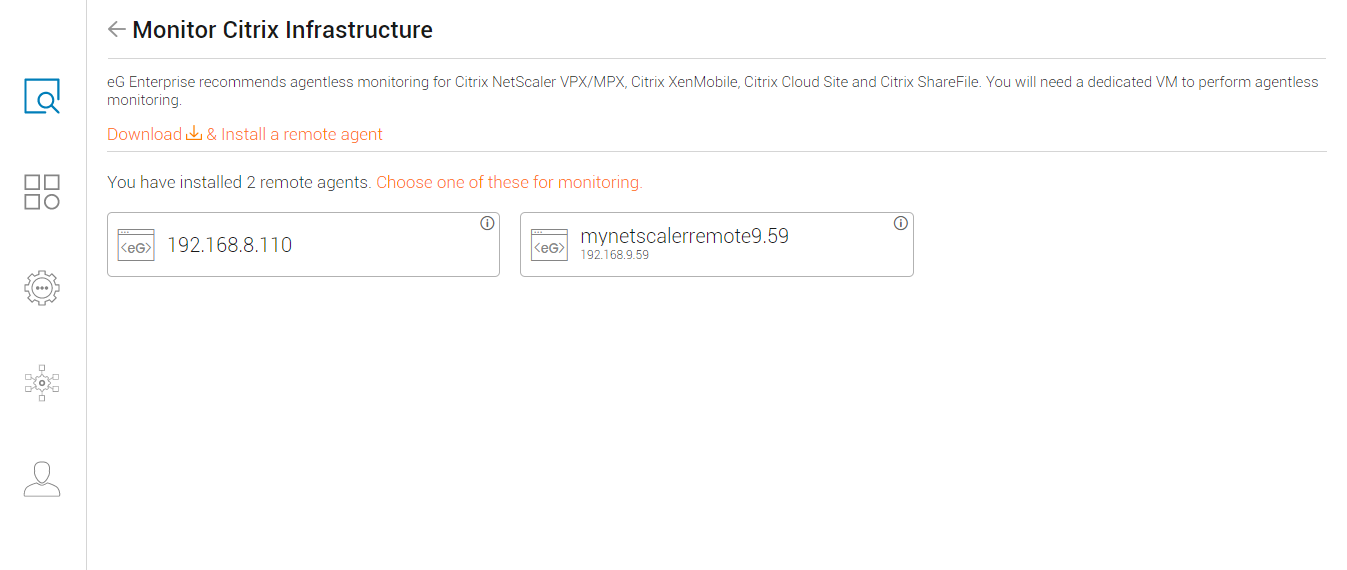
Figure 11 : Configuring agentless monitoring
In Figure 11, click on Download & install a remote agent link to download and install another remote agent for monitoring the components. On the other hand, if you want to use one of the existing remote agents for monitoring the components, then click on the remote agent of choice. Figure 12 will then appear displaying the component types that can be monitored only in an agentless manner.
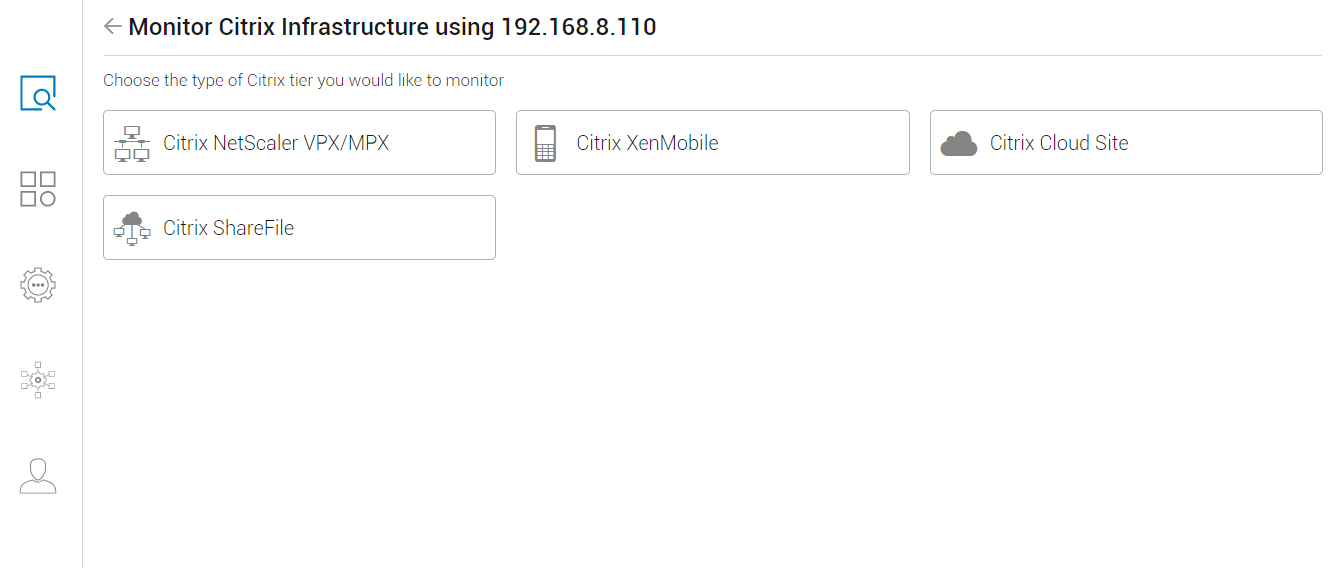
Figure 12 : List of component types that can be monitored in an agentless manner
To manage the component of a type in an agentless manner, click on that component type in Figure 12. Figure 13 will then appear using which you can add the component for monitoring. The remote agent that you chose in Figure 11 will be automatically assigned to the new component.
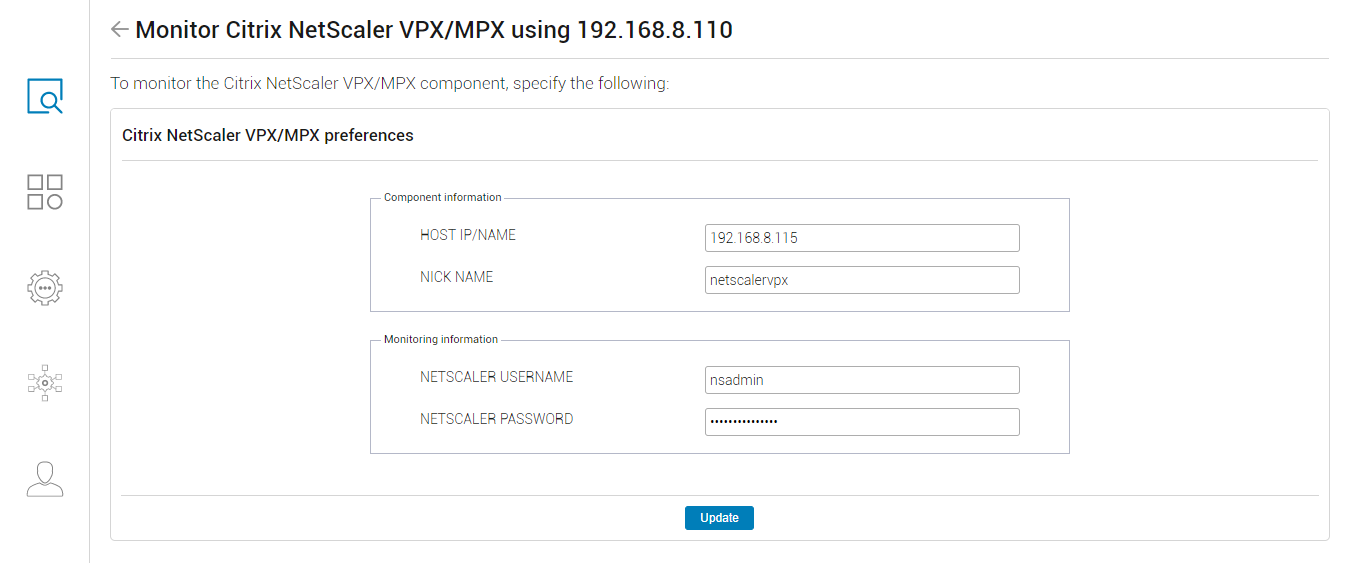
Figure 13 : Adding a component to be monitored in an agentless manner
Moreover, once you configure the parameters listed in Figure 13 and click the Update button, you not only add the component, but also automatically configure all or at least a majority of the tests mapped to that components. This way, with a few mouse clicks, you can make a component monitoring-ready using the Overview page!
Manage Infrastructure
The eG agents once installed will automatically discover the target environment. If for any reason, the agents are unable to discover a few components in the environment, then you can do one/more of the following:
- Try discovering the components using the eG manager or one of the other discovery methodologies that eG Enterprise supports. For more details on eG's discovery techniques, refer to the Discovering Components topic.
- Manually add the components to the eG Enterprise system, using the eG admin interface
For the latter, click on the Manage Infrastructure icon  in the left panel of the Overview page. Figure 14 will then appear.
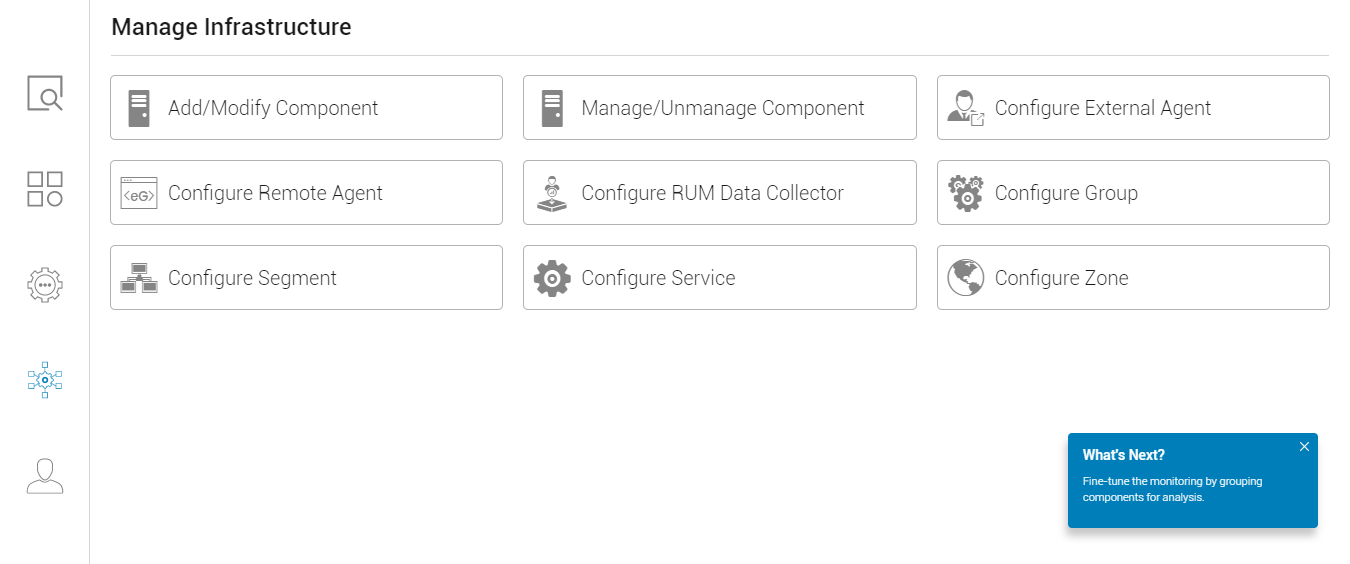
Figure 14 : The Manage Infrastructure section of the Overview page
The Manage Infrastructure page offers the following options:
- Add/Modify Components: As already mentioned, the eG agents auto-discover the components in an environment. Sometimes however, the eG agent may not be able to discover certain components - eg., agents cannot discover network devices in the environment. To monitor such components, the administrator may want to manually add them to the eG Enterprise system. Likewise, the administrator may want to modify the configuration of an auto-managed component - say, to change its port, to assign a different external agent to the component etc. To achieve the above, click the Add/Modify Component option in Figure 14. To know how to add/modify a component using the eG web console, refer to Adding/Modifying/Deleting Components topic.
- Manage/Unmanage Component: By default, a few types of components are configured to be auto-managed upon discovery. By clicking on the Manage/Unmanage Component option in Figure 14 the administrator can, if required, unmanage one/more of these auto-managed components. Likewise, components that are not auto-managed can be manually managed using this option. To know how to manage/unmanage components using the eG user interface, refer to the Managing and Unmanaging Components topic.
- Configure External Agent: External agents are typically used for monitoring network devices and for reporting the availability and responsiveness of managed components over the network. By default, the eG agent on the eG manager host functions as an external agent. If required, an administrator can add more external agents to their environment and assign hosts/devices to them for monitoring. The Configure External Agent option helps with this. To know how to configure additional external agents using the eG user interface, refer to the Configuring External Agents topic.
- Configure Remote Agent: eG Enterprise implements agentless monitoring using Remote Agents. You can use the Configure Remote Agent option to add one/more remote agents and assign remote hosts to them for monitoring. To know how to achieve this, refer to the Configuring Additional Remote Agents topic.
- Configure RUM Data Collector: If you have enabled Real User Monitoring of one/more web sites/applications in your environment, then you will need a RUM Data Collector for collecting and analyzing the beacons of data that browsers send. To know more about RUM and how it works, refer to The eG Real User Monitor document.
- Configure Group: Server groups represent a collection of similar servers. By including a server group in a service topology representation, you can indicate that all the servers in the group have the same set of dependencies on other parts of the infrastructure. Click on the Configure Group option to create new groups, and modify/delete existing groups. To know how to configure groups, refer to the Configuring Groups topic.
- Configure Segment: A segment is a logical entity that represents a collection of components and the interdependencies between them. Segments can be chosen to represent user groups, organizational domains, or physical locations in the tenant environment. For example, the topology of a banking environment may include two segments - one representing all the components in the bank’s NY branch and another representing the bank’s CA branch. Click on Configure Segment to create/modify segments of inter-related components. To know how to configure segments, refer to the Segment Topology topic.
- Configure Service: A service can comprise just one or more independent components offering an end-user service (e.g., a web service offered by a web server). Alternatively, a service can be a number of components working in conjunction. The collection of components and their inter-dependencies constitutes a service. Different business processes of a target infrastructure could be represented as a service. Note that a single segment topology can support multiple services and a single service may involve a subset of the components in a segment. If you want to configure business services for monitoring, click on the Configure Service option. To know how to configure services, refer to the Configuring Services topic.
- Configure Zone: Target infrastructures spanning geographies can pose quite a monitoring challenge owing to the number of components involved and their wide distribution. Administrators might therefore prefer to monitor such an infrastructure by viewing it as smaller, more manageable business units. In eG parlance, these business units are termed zones. A zone can typically comprise of individual components, segments, services, and/or other zones that require monitoring. Click on Configure Zone to create new zones or to delete/modify existing ones. For more details about zone configuration, refer to the Configuring Zones topic.
- Add/Modify Aggregates and Manage/Unmanage Aggregates: eG Enterprise typically monitors every component of a type, separately. However, sometimes, administrators may require aggregate metrics about their infrastructure. For instance, Citrix administrators might want to know the total number of users who are currently logged into all the Citrix servers in a farm, so that sudden spikes in the load on the farm (as a whole) can be accurately detected. To provide such a consolidated view, eG Enterprise embeds a license-controlled Metric Aggregation capability. This feature, when enabled, allows administrators to group one or more components of a particular type in their infrastructure and monitor the group as a single logical component, broadly termed as an aggregate component. To create/modify such aggregate components, click on the Add/Modify Aggregates option. To manage/unmanage aggregates, click on the Manage/Unmanage Aggregates option. For more details about aggregates, refer to the Metric Aggregation topic.
Manage Configuration
Once the components are managed/added and the component groupings are in place, you can proceed to configure the monitoring and alerting rules for those components. For that, click on the Manage Configuration icon  in the left panel of the Overview page. Figure 15 will then appear.
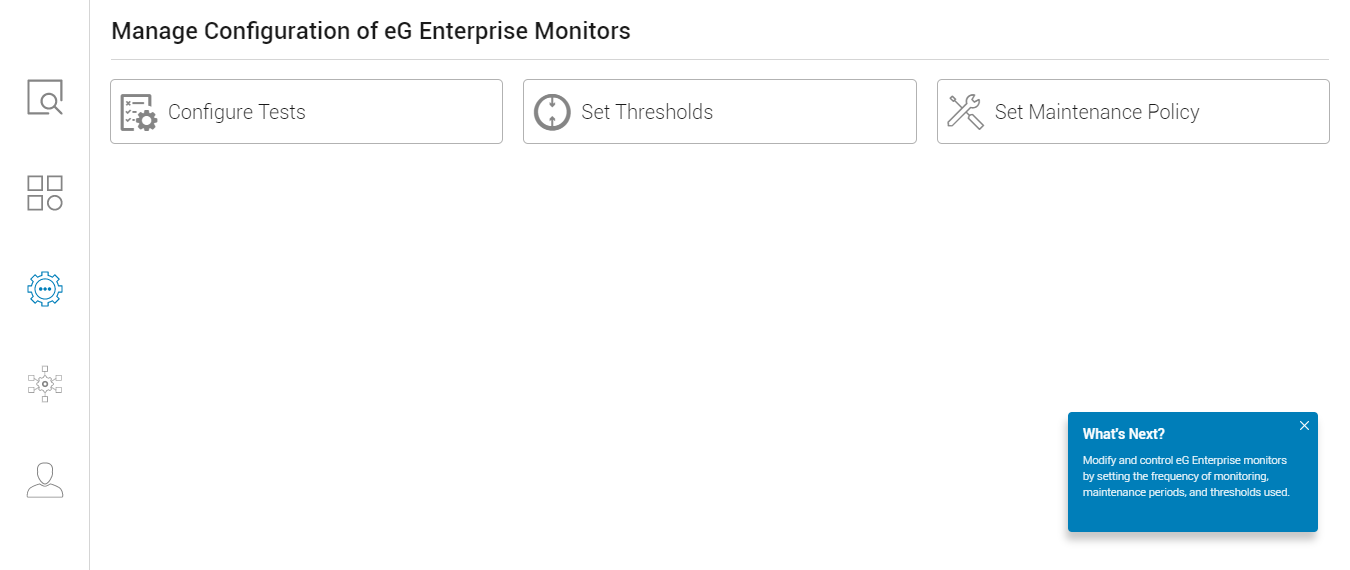
Figure 15 : The Manage Configuration section of the Overview page
Using the options offered by Figure 15, you can perform the following:
- Configure Tests: Click on this option to configure tests for the target components. To know how to configure a test, refer to the Configuring Tests topic.
- Set Thresholds: Thresholds govern the state of a measure. A threshold is characterized by an upper and/or lower limit of performance for the chosen measure. Whenever the threshold is violated, the state of the corresponding measure becomes ‘abnormal’. To configure thresholds for every measure collected from the target infrastructure, click on the Set Thresholds option. To know how to configure thresholds, refer to the Thresholds topic.
- Set Maintenance Policy: To prevent the meaningless generation of alarms during routine maintenance activities, eG Enterprise allows administrators to configure maintenance policies for the components in their monitoring scope. For this purpose, click on the Set Maintenance Policy option in Figure 15. Refer to the Maintenance topic and sub-topics to understand more about maintenance policies and how to configure them.
Manage Users
Now that the components are monitoring-ready, you can proceed to grant users permissions to login to the eG management console and view how the components of interest to them are performing. For this, click on the Manage Users icon  in the left panel of the Overview page. Figure 16 will then appear.
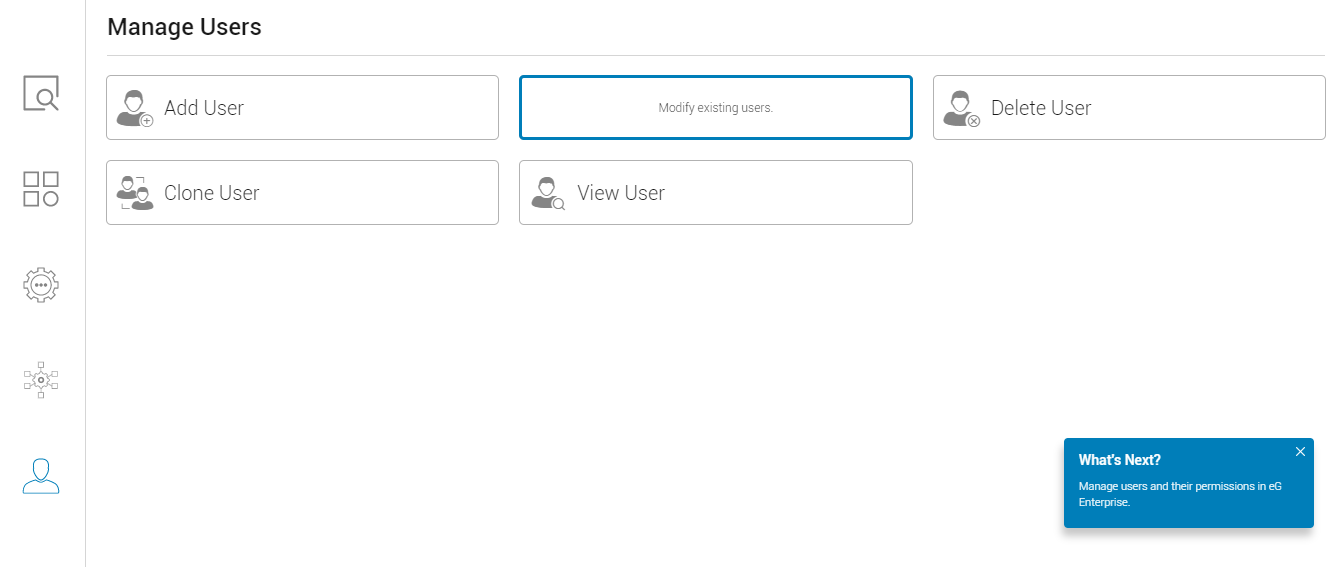
Figure 16 : The Manage Users section of the Overview page
Figure 16 offers the following options:
- Add User: Create a new user by clicking on this option. To know how to create a new user, refer to the Adding New Users topic.
- Modify User: Modify the details of a user by clicking the Modify User option. Refer to the Changing the User Profile topic for details.
- Delete User: Delete one/more existing users by clicking the Delete User option. For the detailed user deletion procedure, refer to the Deleting Users topic.
- Clone User: If you want to clone the details of a user to create a new user then click the Clone User option. To know how cloning works, refer to the Cloning an Existing User's Profile topic.
- View User: For viewing the details of a user, click the View User option. Refer to the Viewing User Details topic.