SharePoint Web Parts Test
By using web parts, you can modify the content, appearance, and behavior of pages of a SharePoint site by using a browser. Web parts are server-side controls that run inside a web part page: they're the building blocks of pages that appear on a SharePoint site.
For problem detection and troubleshooting purposes, administrators should know which web parts operate within a web application, which ones are open presently, and which ones are closed. The SharePoint Web Parts test provides this insight to the administrators. For each web application on SharePoint, this test reports the count of web parts in that web application, and the number of open and closed web parts in that web application. Detailed diagnosis of this test also reveals the names of the open and closed web parts.
Target of the test : A Microsoft SharePoint Server
Agent deploying the test : An internal agent
Outputs of the test : One set of results for each web application in the SharePoint server
| Parameters | Description |
|---|---|
|
Test period |
This indicates how often should the test be executed. |
|
Host |
The host for which the test is to be configured. |
|
Port |
The port at which the host server listens. |
|
Fetch Farm Measures |
Typically, farm-level metrics – eg., metrics on farm status, site collections, usage analytics – will not vary from one SharePoint server in the farm to another. If these metrics are collected and stored in the eG database for each monitored server in the SharePoint farm, it is bound to unnecessarily consume space in the database and increase processing overheads. To avoid this, farm-level metrics collection is by default switched off for the member servers in the SharePoint farm, and enabled only if the server being monitored is provisioned as the Central Administration site. Accordingly, this parameter is set to If Central Administration by default. This default setting ensures that farm-level metrics are collected from and stored in the database for only a single SharePoint server in the farm. If you want to completely switch-off farm-level metrics collection for a SharePoint farm, then set this parameter to No. Some high-security environments may not allow an eG agent to be deployed on the Central Administration site. Administrators of such environments may however require farm-level insights into status and performance. To provide these insights for such environments, you can optionally enable farm-level metrics collection from any monitored member server in the farm, even if that server is not provisioned as the Central Administration site. For this, set this parameter to Yes when configuring this test for that member server. |
|
Domain, Domain User, Password, and Confirm Password |
If the Fetch Farm Measures flag of these tests is set to No or to If Central Administration Site, then this test should be configured with the credentials of a user with the following privileges:
On the other hand, if the Fetch Farm Measures flag of these tests is set to Yes, then the user configured for the tests not only requires the four privileges discussed above, but should also be part of the following groups on the eG agent host:
It is recommended that you create a special user for this purpose and assign the aforesaid privileges to him/her. Once such a user is created, specify the domain to which that user belongs in the Domain text box, and then, enter the credentials of the user in the Domain User and Password text boxes. To confirm the password, retype it in the Confirm Password text box. |
|
Detailed Diagnosis |
To make diagnosis more efficient and accurate, the eG Enterprise embeds an optional detailed diagnostic capability. With this capability, the eG agents can be configured to run detailed, more elaborate tests as and when specific problems are detected. To enable the detailed diagnosis capability of this test for a particular server, choose the On option. To disable the capability, click on the Off option. The option to selectively enable/disable the detailed diagnosis capability will be available only if the following conditions are fulfilled:
|
|
Measurement |
Description |
Measurement Unit |
Interpretation |
|---|---|---|---|
|
Total web parts |
Indicates the number of web parts in this web application. |
Number |
|
|
Open web parts |
Indicates the number of open web parts in this web application. |
Number |
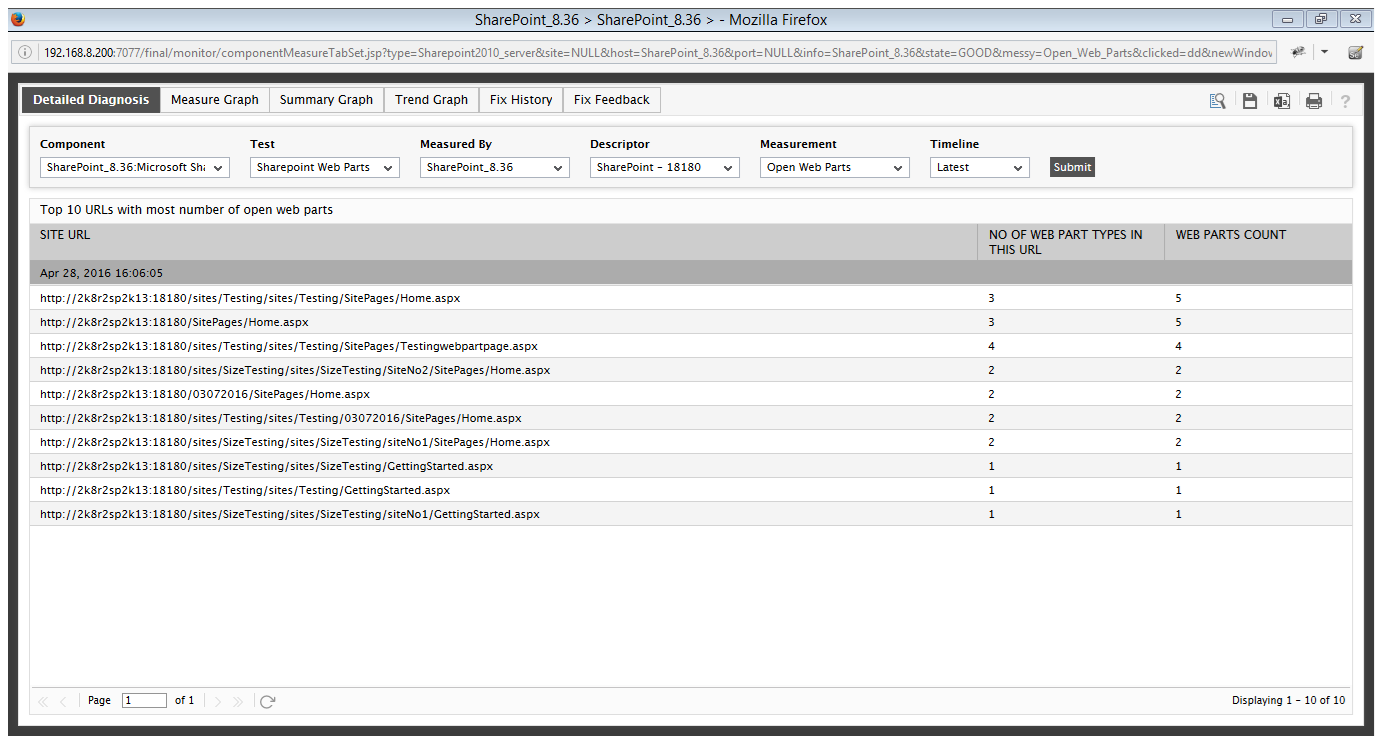
Use the detailed diagnosis of this measure to view the top-10 URLs with the most number of open web parts. From this, you can quickly identify the URL with the maximum number of open web parts. |
|
Closed web parts |
Indicates the number of closed web parts in this web application. |
Number |
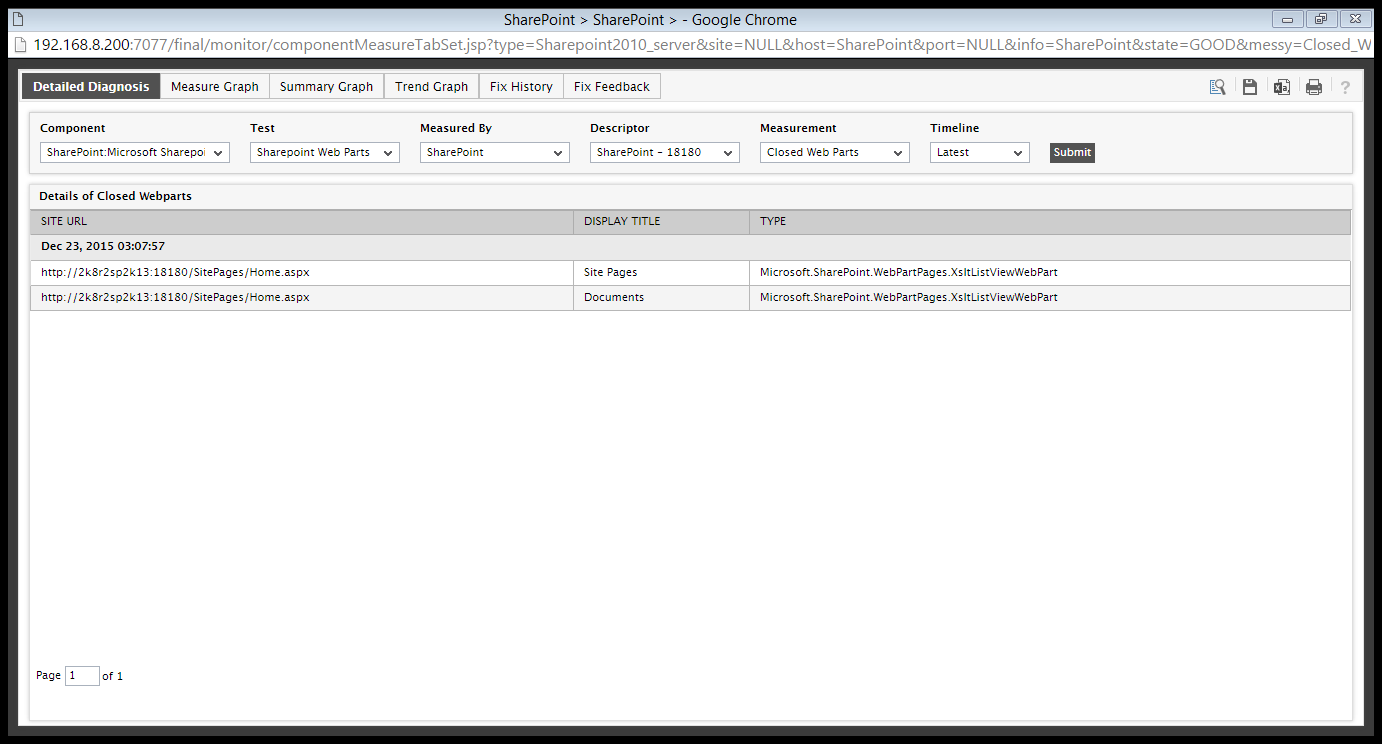
Use the detailed diagnosis of this measure to determine which web parts are closed in the target web application. |
Use the detailed diagnosis of the Open web parts measure to view the top-10 URLs with the most number of open web parts. From this, you can quickly identify the URL with the maximum number of open web parts.

Figure 1 : The detailed diagnosis of the Open web parts measure
Use the detailed diagnosis of the Closed web parts measure to determine which web parts are closed in the target web application.

Figure 2 : The detailed diagnosis of the Closed web parts measure