English


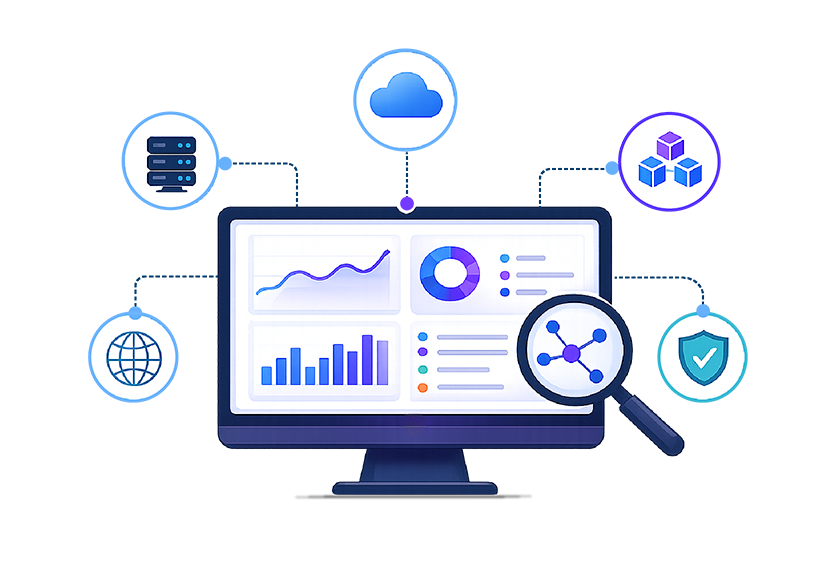
Modern IT ecosystems have undergone a profound transformation. Organizations have shifted from monolithic applications running on static infrastructure to highly distributed, cloud-native environments powered by microservices, containers, and Kubernetes. This shift has unlocked unprecedented scalability and agility, but it has also introduced new layers of complexity that traditional monitoring tools were never designed to handle. As a result, network observability tools have become essential for ensuring performance, reliability, and seamless digital experiences.
Introduction
The rise of cloud-native architectures has reshaped how applications are built, deployed, and operated. Microservices break applications into smaller, independently deployable components that communicate over the network. Containers package these services into lightweight, portable units. Kubernetes orchestrates them at scale. Hybrid and multi-cloud environments add even more dynamism, with workloads shifting across clusters, regions, and cloud providers.
While these technologies offer tremendous benefits, they also create challenges. Service-to-service communication becomes more complex. Network paths change constantly. Traffic patterns shift unpredictably. Traditional network monitoring tools, which focus on device health and static thresholds, cannot provide the depth of insight required to understand performance issues in distributed systems.
Network observability tools address this gap by offering deep, contextual visibility into how applications behave across networks, infrastructure, and cloud environments. They help teams detect anomalies, troubleshoot issues faster, and maintain optimal user experience.
What are Network Observability Tools?
Network observability tools provide comprehensive visibility into the behavior, performance, and dependencies of distributed applications and the networks that support them. They collect and correlate telemetry data such as metrics, logs, traces, and network flows to help teams understand not just what is happening, but why it is happening.
These tools go beyond traditional monitoring by enabling exploratory analysis. Instead of relying solely on predefined thresholds, observability platforms allow teams to investigate unknown issues, uncover hidden dependencies, and identify root causes across complex environments.
Network Monitoring vs Network Observability
Network monitoring focuses on tracking the health and performance of network devices, interfaces, and bandwidth usage. It answers questions like whether a router is up or down, or whether a link is congested. Monitoring is reactive and limited to known failure conditions.
Network observability, by contrast, is proactive and holistic. It provides deep insights into network behavior, application dependencies, and service interactions. Observability tools ingest diverse telemetry data and correlate it to reveal patterns, anomalies, and performance bottlenecks. They help teams understand the context behind issues, not just the symptoms.
Monitoring tells you “when” something is wrong, observability tells you “why” something is wrong and what needs to be fixed.
Why Observability Matters in Modern IT Environments
Distributed systems generate massive amounts of telemetry data. Without observability, teams struggle to understand how services interact, where bottlenecks occur, and how user experience is impacted. Observability enables faster troubleshooting, reduces downtime, and supports continuous optimization.
It also plays a critical role in supporting DevOps, SRE, and platform engineering teams. Observability helps these teams maintain reliability, automate incident response, and ensure that applications meet performance expectations.
Core Components of Network Observability
Network observability is built on several key components:
- Metrics provide quantitative data about performance trends, such as latency, throughput, and error rates.
- Logs capture event-level details that help teams understand what happened at specific points in time.
- Traces follow requests as they travel across microservices, APIs, and network layers, revealing dependencies and bottlenecks.
- Network flow analytics provide visibility into traffic patterns, communication paths, and bandwidth usage.
Together, these components create a comprehensive view of system behavior.
Why Enterprises Need Network Observability Tools
As organizations adopt cloud-native architectures, the need for network observability becomes increasingly critical.
Visibility Across Distributed Applications and Services
Modern applications span multiple clouds, data centers, and container platforms. Observability tools provide unified visibility across these environments, helping teams understand dependencies and interactions. This visibility is essential for maintaining performance and reliability.
Faster Troubleshooting and Root Cause Analysis
By correlating telemetry data from multiple sources, observability tools reduce mean time to resolution. Teams can quickly identify whether an issue originates from the network, application code, infrastructure, or external services. This accelerates incident response and minimizes downtime.
Improved Performance, Reliability, and User Experience
Observability ensures that performance issues are detected early, before they impact users. It also supports capacity planning, optimization, and proactive incident prevention. By understanding how network behavior affects application performance, teams can deliver better digital experiences.
How Network Observability Supports Microservices Architectures
Microservices architectures introduce new challenges due to their distributed nature. Observability plays a crucial role in ensuring performance and reliability.
Understanding Service-to-Service Communications
Each microservice communicates with others over the network. Observability tools map these interactions, helping teams understand dependencies and identify performance hotspots. This is essential for troubleshooting issues that span multiple services.
Monitoring East-West Traffic Across Microservices
East-west traffic refers to internal data flows within a data centre or cloud environment. It includes communication between microservices, virtual machines, containers, and internal APIs. Monitoring this traffic requires visibility into load balancers, firewalls, virtualized platforms, cloud networking layers, and hyper-converged systems. Observability tools must support a wide range of devices and platforms to ensure complete visibility.
Identifying Latency, Packet Loss, and Network Bottlenecks
Latency spikes, packet drops, and congestion can degrade application performance. Observability tools detect these issues in real time and correlate them with affected services. This helps teams identify root causes and implement corrective actions.
Supporting Kubernetes and Containerized Workloads
Kubernetes environments are highly dynamic. Pods scale up and down, IPs change frequently, and workloads move across nodes. Observability tools track these changes and provide context for troubleshooting. They help teams understand how network behaviour affects containerized workloads.
Essential Features of Modern Network Observability Tools
Modern observability platforms offer a range of capabilities designed for cloud-native environments.
Real-Time Network Topology and Dependency Mapping
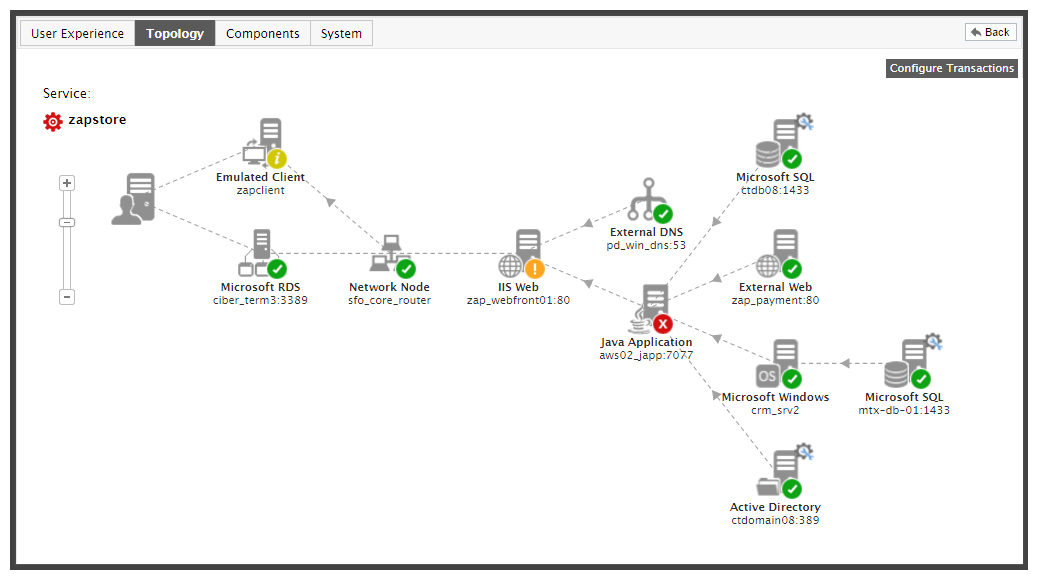
Dynamic topology maps show how services, applications, and network components interact. They update automatically as environments change, providing real-time visibility into dependencies and communication paths.
Distributed Tracing Across Applications and Networks
Distributed tracing follows requests as they travel across microservices, APIs, and network layers. It helps teams pinpoint slow services, failed calls, and bottlenecks. Tracing is essential for understanding performance issues in distributed systems.
AI-Powered Root Cause Analysis
AIOps capabilities enhance observability by analyzing large volumes of telemetry data, detecting anomalies, and identifying probable root causes. This reduces manual investigation and accelerates resolution. AIOps also helps reduce alert fatigue by correlating related events and highlighting the most important issues.
Network Flow Analytics and Traffic Visibility
Flow analytics reveal traffic patterns, bandwidth usage, and communication paths. They help teams detect unusual behavior, optimize performance, and ensure that network resources are used efficiently.
Infrastructure, Cloud, and Kubernetes Monitoring
Observability tools integrate data from servers, containers, cloud services, and network devices to provide a unified view of system health. This full-stack visibility is essential for troubleshooting issues that span multiple layers.
The Role of Microservices Monitoring Tools in Observability
Microservices monitoring tools complement network observability by providing application-level insights.
Monitoring Application Performance Across Services
These tools track response times, error rates, throughput, and service dependencies. They help teams understand how application behavior impacts network performance and user experience.
Correlating Application and Network Metrics
By correlating application metrics with network telemetry, teams can identify whether performance issues originate from code, infrastructure, or network paths. This correlation is essential for accurate root cause analysis.
Improving Incident Response Through Full-Stack Visibility
Full-stack visibility ensures that teams can quickly diagnose issues across all layers, reducing downtime and improving reliability. Microservices monitoring tools play a key role in providing this visibility.
Best Practices for Implementing Network Observability
Successful observability requires a strategic approach.
Establish End-to-End Visibility
Organizations should ensure visibility across applications, networks, infrastructure, and cloud environments. This includes monitoring east-west traffic, service dependencies, and user experience.
Correlate Network, Infrastructure, and Application Data
Correlation provides context and accelerates troubleshooting. Observability platforms should unify telemetry data from multiple sources to provide a holistic view of system behavior.
Use Intelligent Alert Correlation
AIOps-driven alert correlation reduces noise and helps teams focus on meaningful incidents. This improves operational efficiency and reduces alert fatigue.
Monitor User Experience Alongside Network Performance
User experience monitoring ensures that performance issues are detected early and resolved before they impact customers. It also helps teams understand how network behavior affects real-world performance.
Common Challenges in Network Observability
Despite its benefits, observability comes with challenges.
Alert Fatigue and Data Overload
Large volumes of telemetry data can overwhelm teams. AIOps helps filter noise and highlight actionable insights, but organizations must also implement effective alerting strategies.
Dynamic Cloud and Container Environments
Constantly changing environments require tools that automatically adapt to new services, IPs, and workloads. Observability platforms must be designed for dynamism.
Limited Context Across Hybrid Infrastructure
Hybrid environments span on-premises, cloud, and edge locations. Observability tools must provide unified visibility across all layers to ensure accurate troubleshooting.
How eG Innovations Delivers Comprehensive Network Observability
eG Innovations provides a unified observability platform designed for modern, distributed environments. eG Enterprise supports over 650 technologies across networking, storage, cloud, microservices, infrastructure, and applications, making it one of the most comprehensive platforms available.
End-to-End Visibility Across Applications, Infrastructure, and Networks
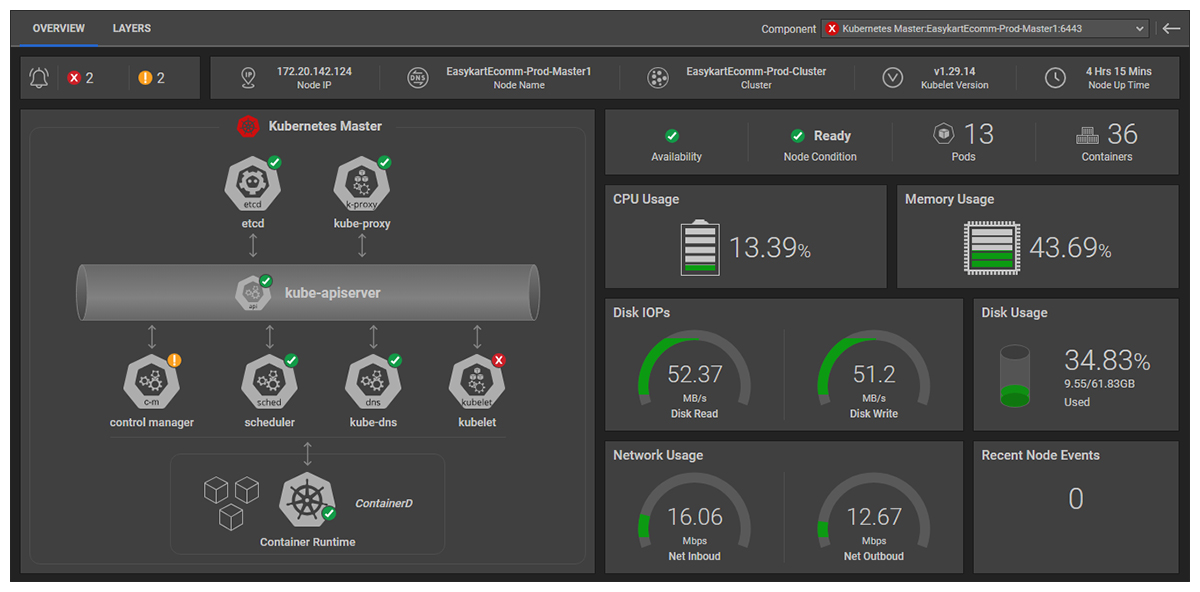
eG Enterprise delivers complete visibility using both real user monitoring and synthetic monitoring. It supports a wide range of networking technologies including routers, switches, firewalls, load balancers, SDN components, virtualized networks, cloud networking services, and hyper-converged platforms. This ensures that teams can monitor every layer of the digital ecosystem.
AI-Driven Performance Analytics
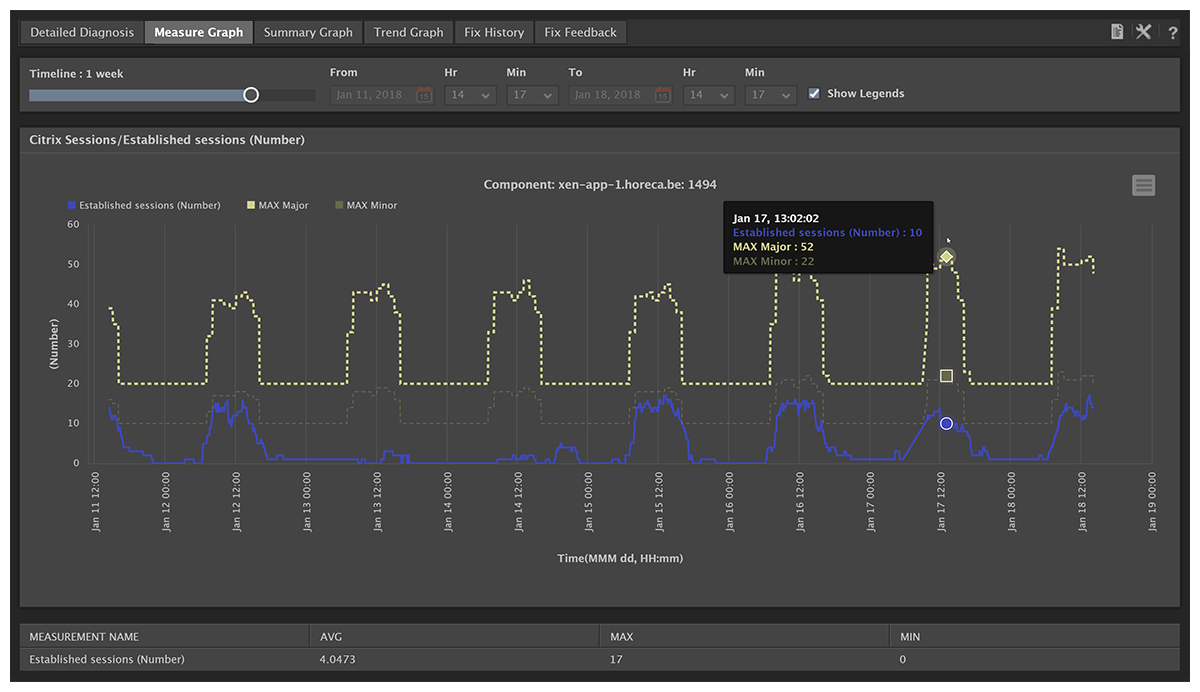
AIOps capabilities within eG Enterprise analyze telemetry data, detect anomalies, and provide intelligent insights. This reduces alert fatigue and accelerates troubleshooting. The platform uses machine learning to identify patterns, predict issues, and recommend corrective actions.
Distributed Tracing and Dependency Mapping
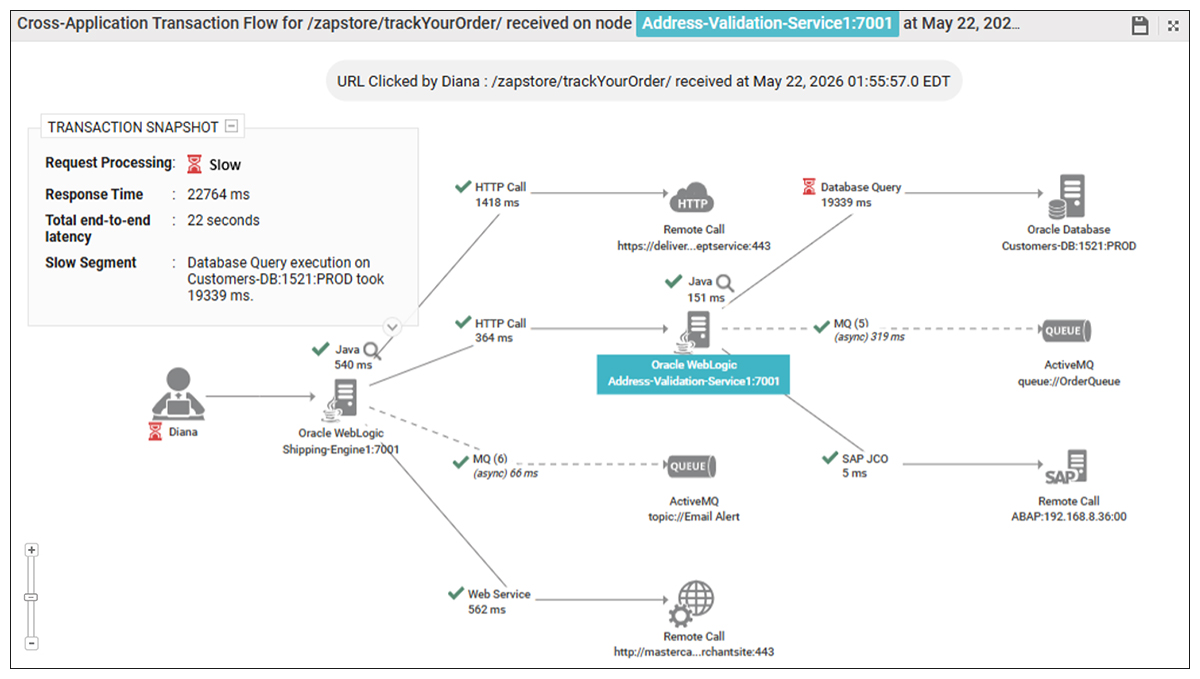
eG Enterprise offers distributed tracing to track transactions across microservices, APIs, and network paths. Dependency mapping reveals how services interact and helps teams identify bottlenecks. This is essential for troubleshooting issues in complex, distributed environments.
Faster Root Cause Identification
By correlating metrics, logs, traces, and network data, eG Enterprise enables rapid root cause analysis. Teams can quickly determine whether issues originate from the network, application code, infrastructure, or external services. This reduces downtime and improves reliability.
Conclusion
The future of distributed systems depends on deep, contextual visibility across networks, applications, and infrastructure. As cloud-native adoption grows, network observability tools will become essential for maintaining performance, reliability, and user experience. Organizations that invest in observability today will be better equipped to manage complexity, accelerate innovation, and deliver seamless digital services.
Comparing platforms? Book a 30-minute technical walkthrough of eG Enterprise. We will demonstrate full-stack observability, topology-driven root-cause analysis, and adaptive baselining against scenarios drawn from your own environment, not generic demo data.
eG Enterprise is an Observability solution for Modern IT. Monitor digital workspaces,
web applications, SaaS services, cloud and containers from a single pane of glass.
Frequently Asked Questions
They are platforms that provide deep visibility into network behaviour, performance, and dependencies across distributed environments.
Monitoring tracks predefined metrics, while observability provides contextual insights that help teams investigate unknown issues.
Microservices rely heavily on network communication. Observability helps teams understand service interactions and detect performance issues.
They identify bottlenecks, detect anomalies, and correlate telemetry data to accelerate troubleshooting.
Key features include distributed tracing, topology mapping, flow analytics, AIOps, and full-stack visibility.
Yes, some modern observability tools provide visibility into both networking and dynamic Kubernetes workloads, pods, services, and network paths.
Monitoring focuses on tracking predefined metrics and alerts to tell you when something goes wrong, typically answering “what is happening?” Observability goes further by using metrics, logs, and traces to explain system behavior and answer “why it is happening.” While monitoring is reactive and limited to known issues, observability is exploratory, enabling deeper debugging, root-cause analysis, and better understanding of complex distributed systems.
Some observability platforms provide support for both networking and Kubernetes. Popular choices include Dynatrace, Datadog and eG Enterprise.
Distributed tracing improves network observability by providing end-to-end visibility into how requests travel across applications, services, APIs, and network infrastructure. Instead of monitoring individual components in isolation, tracing follows a transaction from start to finish, showing every hop, dependency, and delay along the path.
Network observability relies on multiple types of telemetry data to provide a complete view of network performance, health, and user experience. By combining these data sources, observability platforms can identify issues faster and determine their root cause.
Common telemetry data used in network observability includes:
- Metrics: Performance measurements such as bandwidth utilization, latency, packet loss, jitter, interface errors, CPU usage, and memory consumption.
- Logs: Event records generated by routers, switches, firewalls, load balancers, and other network devices.
- Traces: Distributed tracing data that follows transactions across applications, services, and network paths to identify delays and failures.
- Flow Data: NetFlow, sFlow, IPFIX, and similar technologies that provide visibility into traffic patterns, conversations, and bandwidth consumption.
- Topology Data: Information about network devices, dependencies, and connectivity relationships.
- Configuration Data: Device configurations and policy information used to identify configuration-related issues.
- Synthetic Monitoring Data: Results from simulated transactions and network tests that measure service availability and performance from an end-user perspective. Learn more: Synthetic Transaction Monitoring | eG Innovations.
Together, these telemetry sources provide the context needed for anomaly detection, root-cause analysis, capacity planning, and proactive network management.
Yes. Network observability can significantly reduce Mean Time to Resolution (MTTR) by providing real-time visibility into network performance, dependencies, and traffic flows across the entire IT environment.
Traditional network monitoring often alerts teams to symptoms such as high latency or packet loss but provides limited context about the root cause. Network observability goes further by correlating metrics, logs, traces, topology data, and network flows to quickly identify where and why a problem is occurring.
AIOps and network observability are highly complementary. Network observability provides the telemetry and visibility, while AIOps provides the intelligence and automation needed to analyze that data at scale.
Network observability collects and correlates telemetry such as metrics, logs, traces, flow data, topology information, and configuration changes from across the network. This gives operations teams a detailed view of what is happening throughout the environment.
AIOps then applies machine learning, anomaly detection, event correlation, and predictive analytics to this telemetry. It can automatically identify unusual behavior, reduce alert noise, correlate events across network, infrastructure, and application layers, and pinpoint the most likely root cause of performance issues.
Together, network observability and AIOps enable organizations to move beyond simple fault detection toward proactive operations. Instead of manually investigating hundreds of alerts and dashboards, IT teams gain actionable insights, faster root-cause analysis, lower MTTR, improved service reliability, and the ability to predict and prevent issues before they impact users.