Content Growth Analysis Report
A SharePoint administrator should constantly keep track of the growth of the SharePoint and Content databases to proactively detect and if possible, avert, abnormal growth in database size. For this purpose, eG Enterprise offers the Content Growth Analysis report. By generating this report, administrators can identify the growth rate of the content database over a period of time. The storage space used by the recycle bin and the content databases are analysed to figure out if the database has recorded abnormal growth over a period of time. The growth rate of the site collections and the sites are also analysed for abnormalities. The top active site collections and the sites in terms of growth helps administrators in identifying site collections/sites that may require additional storage space.
To generate the report, do the following:
- Follow the menu sequence: REPORTS BY FUNCTION -> Domain-specific Reports -> Microsoft SharePoint -> Content Growth Analysis.
-
Figure 1 then appears. In Figure 1, select a criteria for analysis from the Analyze By list box.
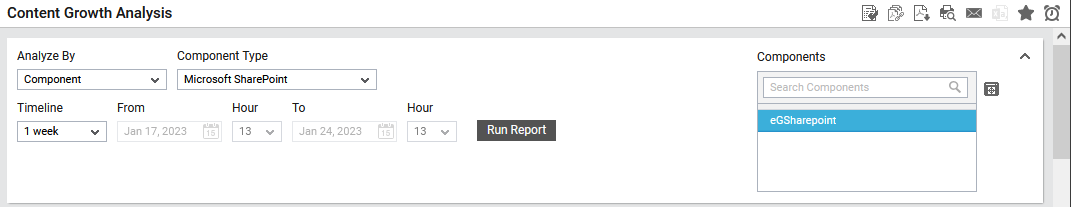
Figure 1 : Specifying the criteria for generating the Mailboxes report
-
Using this report, you can analyze the growth of SharePoint and Content databases in one/more managed components, or those that are part of a zone, service or segment. The options provided by the Analyze By list box are discussed hereunder:
- Component: Select this option to choose the component(s) from across all the managed components in the environment.
- Zone: To generate a report for one/more components that are included in a zone, pick the Zone option. A Zone drop-down list will then appear, from which you would have to select the zone to which the components of interest to you belong. A Sub zone flag also appears. Indicate whether the components present within the sub-zones of the chosen zone are also to be to be considered for report generation, by setting the Sub zone flag to Yes.
- Segment: If you want to generate a report for one/more chosen components that belong to a segment, select the Segment option from Analyze By list box, and then pick the Segment from the drop-down list that appears.
- Service: If you want to generate a report for one/more components involved in the delivery of a service, select the Service option from Analyze By, and then pick the required Service from the drop-down list that appears.
- Choose a Component Type for which the report is to be generated.
- The Components list will now be populated with all the components that are managed in your environment for the chosen component type. If the Components list consists of too many components, then viewing all the components and selecting the ones you need for report generation could require endless scrolling. To avoid this, you can click the
 button next to the Components list. A Components pop up window will then appear using which you can view almost all the components in a single interface and Select the ones to be included in this report.
 -
Then, specify the Timeline for generating this report. You can either provide a fixed time line such as 1 hour, 2 days, etc., or select the Any option from the list to provide a From and To date/time for report generation.
Note:
For every user registered with the eG Enterprise system, the administrator can indicate the maximum timeline for which that user can generate a report. Once the maximum timeline is set for a user, then, whenever that user logs into eG Reporter and attempts to generate a report, the Timeline list box in the report page will display options according to the maximum timeline setting of that user. For instance, if a user can generate a report for a maximum period of 3 days only, then 3 days will be the highest option displayed in the Timeline list - i.e., 3 days will be the last option in the fixed Timeline list. Similarly, if the user chooses the Any option from the Timeline list and proceeds to provide a start date and end date for report generation using the From and To specifications, eG Enterprise will first check if the user's Timeline specification conforms to his/her maximum timeline setting. If not, report generation will fail. For instance, for a user who is allowed to generate reports spanning over a maximum period of 3 days only, the difference between the From and To dates should never be over 3 days. If it is, then, upon clicking the Run Report button a message box will appear, prompting the user to change the From and To specification.
-
In addition to the settings discussed above, this report comes with a set of default specifications. These settings are hidden by default. If you do not want to disturb these default settings, then you can proceed to generate the report by clicking the Run Report button soon after you pick one/more components for report generation. However, if you want to view and then alter these settings (if required), click on the
 icon. The default settings will then appear in the MORE OPTIONS drop down window (See Figure 2). The steps below discuss each of these settings and how they can be customized.
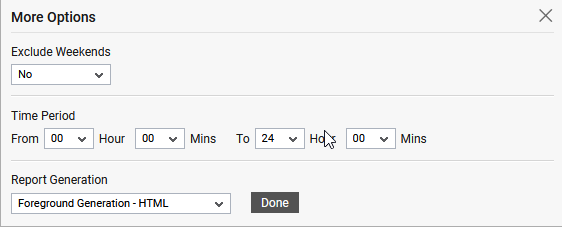
-
If the timeline specified for the report needs to exclude the data collected during the Weekends, then set Exclude weekends to Yes. If not, select No.
Note:
By default, the weekend constitutes Saturday and Sunday. To override this default setting, do the following:
- Edit the eg_report.ini file in the <EG_INSTALL_DIR>\manager\config directory.
- In the [EXCLUDE_WEEKEND] section of the file, the Days parameter is set to Saturday,Sunday by default. You can modify this by setting the Days parameter to a comma-separated list of other days of the week - say Friday,Saturday.
- Save the file after making the required changes.
-
Next, indicate the report Time period.
Note:
By default, the Time period is set to 24 hours. Accordingly, the From and To parameters in the [timeframe] section of the eg_report.ini file (in the <eg_install_dir>\manager\config directory) are set to 00:00 and 24:00 respectively. If need be, you can override this default setting by configuring a different timeframe against the From and/or To parameters.
-
In large environments, reports generated using months of data can take a long time to complete. Administrators now have the option of generating reports on-line or in the background. When a report is scheduled for background generation, administrators can proceed with their other monitoring, diagnosis, and reporting tasks, while the eG manager is processing the report. This saves the administrator valuable time. To schedule background processing of a report, you can either select the Background Save - PDF option from the Report Generation list. To process reports in the foreground, select the Foreground Generation - HTML option from this list.
Note:
- The Report Generation list will appear only if the EnableBackgroundReport flag in the [BACKGROUND_PROCESS] section of the eg_report.ini file (in the <EG_INSTALL_DIR>\manager\config directory) is set to Yes.
- The default selection in the Report Generation list will change according to the Timeline specified for the report. If the Timeline set is greater than or equal to the number of days specified against the MinDurationForReport parameter in the [BACKGROUND_PROCESS] section of the eg_report.ini file, then the default selection in the Report Generation list will be Background Save - PDF. On the other hand, if the Timeline set for the report is lesser than the value of the MinDurationForReport parameter, then the default selection in the Report Generation list will be Foreground. This is because, the MinDurationForReport setting governs when reports are to be processed in the background. By default, this parameter is set to 2 weeks - this indicates that by default, reports with a timeline of 2 weeks and above will be processed in the background.
- Click the Done button if any changes were made to the More Options drop down window.
- Finally, click the Run Report button to generate the report.
-
If the Report type is Foreground Generation - HTML, then Figure 3 will appear as soon as you click the Run Report button.
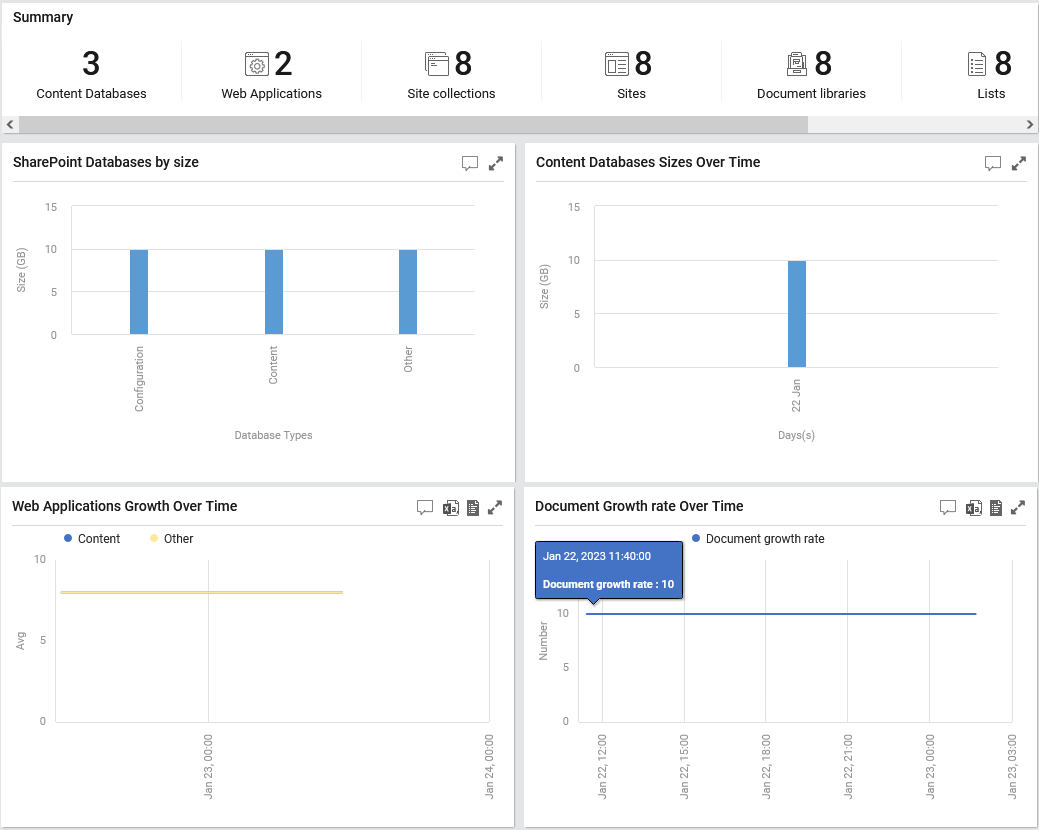
Figure 3 : The generated Content Growth Analysis report
The generated report contains the following sections:
-
A Summary section (see Figure 3) reveals the overall count of contents of the critical SharePoint data containers such as content databases, sites and site collections, lists, document libraries and web applications during the chosen time period. By merely looking at this section, administrators can identify which content is predominantly available in the target SharePoint data container - is it Content databases? or Site Collections? or Sites? etc.
-
The SharePoint Databases by size (see Figure 3) bar graph reveals the size of different types of databases that were typically installed for SharePoint during the chosen time period? By merely looking at this graph, administrators can identify which type of database was larger in size during the chosen time period - is it the Configuration database? or Content database? or Other database?
-
The Content Databases Sizes Over Time (see Figure 3) bar graph reveals how well the databases of Content Database type had grown over the chosen time period. By looking at this graph, administrators can identify the database that had grown abnormally in terms of size and when exactly the growth had occurred.
-
The Web Applications Growth Over Time (see Figure 3) timeline chart reveals the average growth in the size of each web application over the chosen time period. By looking at this graph, administrators can determine whether/not the web application is growing rapidly in size. Also, administrators can identify the exact web application that is consuming all available storage resources.
-
The Document Growth rate Over Time timeline chart (see Figure 3) reveals the number of documents that had grown over a chosen time period. By looking at this graph, administrators can figure out a consistent addition of new documents to SharePoint and also analyze if the increase in the addition of documents is sudden or sporadic.
-
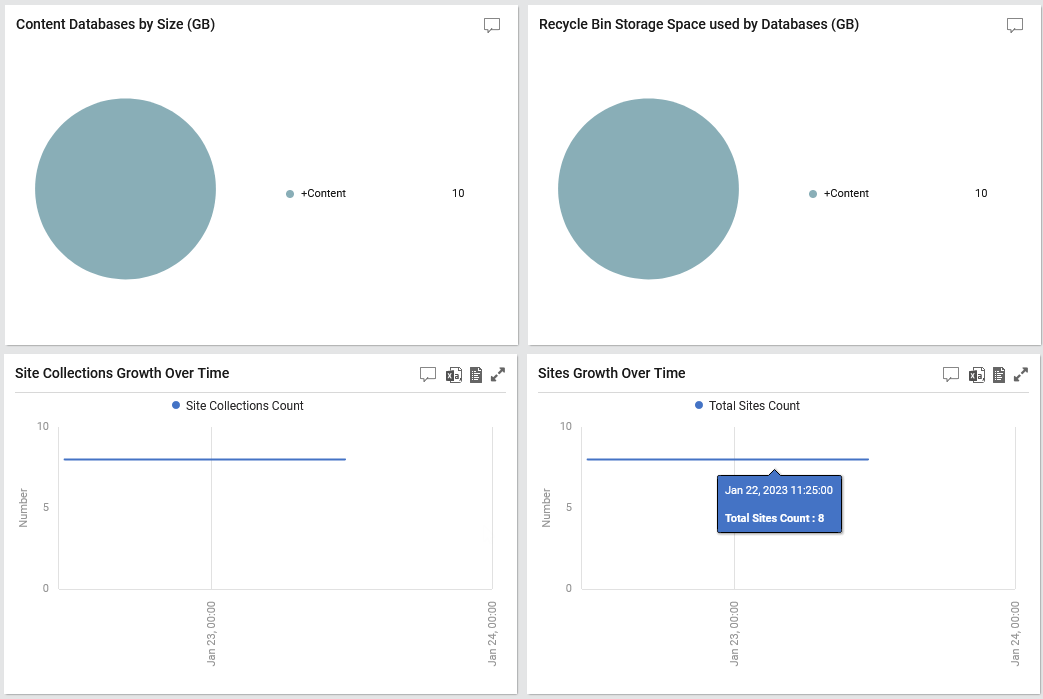
The Content Databases by Size (see Figure 4) pie chart reveals the distribution of each database of Content database type in terms of the size. This helps administrators identify the content database that had grown rapidly over a period of time.
-
The Recycle Bin Storage Space used by Databases pie chart (see Figure 4) reveals the distribution of space used in the second stage recycle bin of each database in the SharePoint. Using this chart, administrators can identify the database that is contributing to the steadily accumulation of deleted data in the recycle bin.
-
The Site Collections Growth Over Time graph (see Figure 4) reveals the number of site collections available in the target SharePoint environment during the chosen time period. By looking at this graph, administrators can identify the exact date/time on which the number of site collections exceeded the recommended number of site collections per SharePoint farm.
The Site Growth Over Time graph (see Figure 4) reveals the number of sites available in across all sites of the target SharePoint environment during the chosen time period. By looking at this graph, administrators can identify the exact date/time on which the number of sites exceeded the recommended number of sites across site collections.
-
The File Types Distribution pie chart (see Figure 5) helps administrators identify which file type had been occupying the maximum percentage of space in the target environment over the chosen time period - is it the data files? or roster files? or audio files? or video files? etc. This helps administrators accurately analyze the file type that had been hogging space.
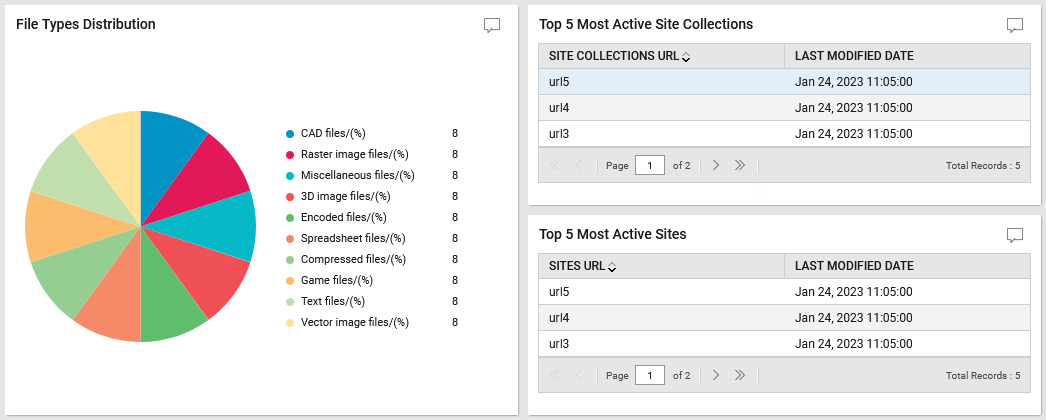
Figure 5 : Identifying the file types, active site collections and site
-
The Top 5 Most Active Site Collections section (see Figure 5) reveals those site collections that were actively used during the chosen time period. This way, administrators can figure out the site collection that was most sought after in the recent past.
-
The Top 5 Most Active Sites section (see Figure 5) reveals those sites that were actively used during the chosen time period. This way, administrators can figure out the site that was most sought after in the recent past.
-
