Default Reports
This option provides a way for an administrator to refine the default report templates provided with eG Enterprise. To configure default reports, first, select the Default Reports option by following the menu sequence: Admin -> Settings -> Reporter. Doing so will reveal the following page (see Figure 1).
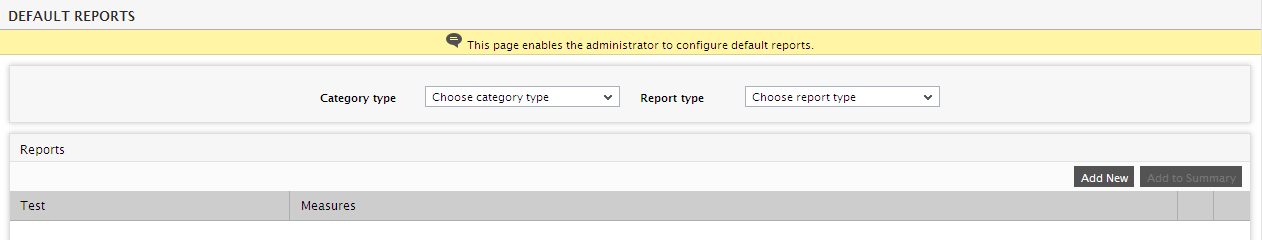
Figure 1 : The eG Default Reports page
Clicking the Add New button in Figure 1 will reveal Figure 2 using which you can add the measures of your choice for configuring the report templates.
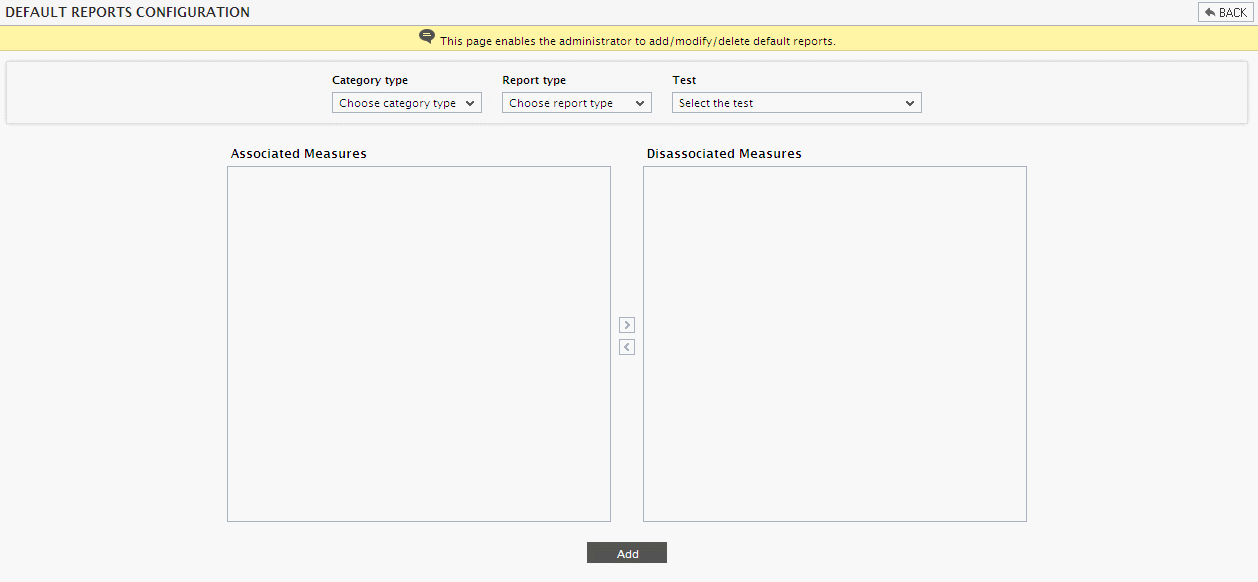
Figure 2 : The Default Report Configuration page
In order to provide the users with adequate insight into the performance of the critical network, server, and application tiers of their infrastructure, the eG Reporter further classifies operations reports as Network, System, Application and Site. The sections to come will discuss each of these classifications at length.
Network Reports
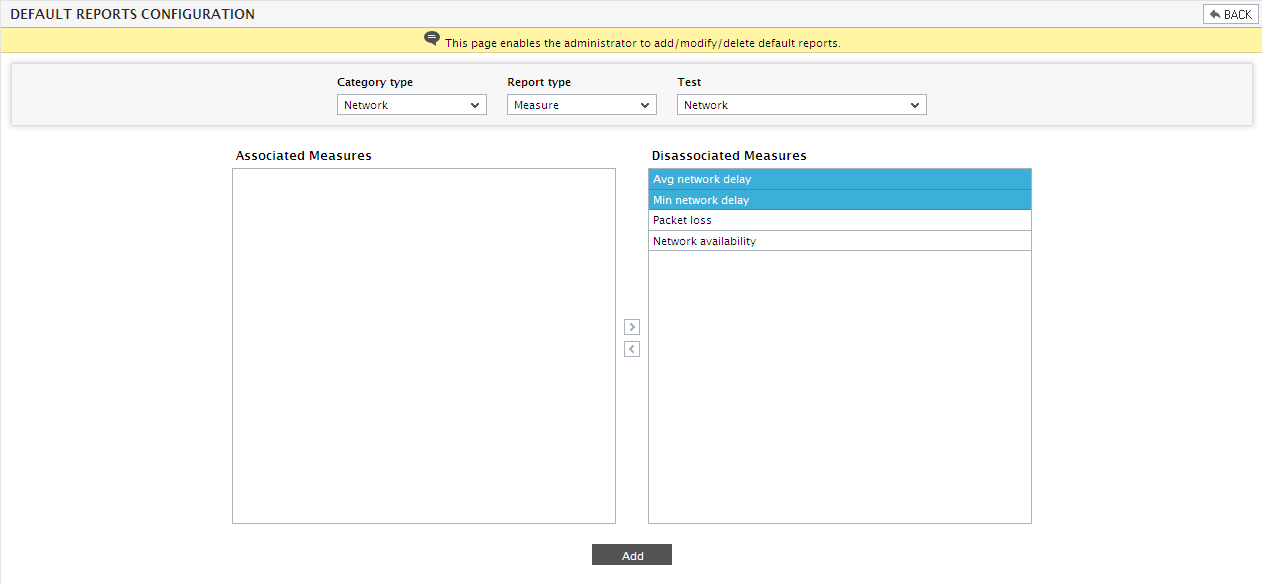
Operations reports targeting the network tier of an infrastructure are classified as Network Reports. To generate default Network Reports using Figure 1, do the following:
- Select Network as the Category type (see Figure 3).
-
Select a Report type from the list box (see Figure 3). The options to choose from include:
- Measure: Measurement reports depict various measurement values plotted with time of day. The time period for these reports can be configured by the user.
- Summary: Summary reports highlight the service levels of different measurements (i.e., the % of time a measurement was in compliance with its threshold). The service levels can be assessed on an hourly, daily, or monthly basis.
- Next, to select the measures for which a report of the selected type is to be generated, first, choose the Test that generates the measures (see Figure 3).
-
Upon selection, all the measures associated with the selected test will appear in the Disassociated Measures list (see Figure 3).
-
Then, from the Disassociated Measures list, select the measures for which reports of the selected type are to be generated. Next, click on the < button to transfer the selected measures to the Associated Measures list. Finally, click on the Add button. This ensures that reports of the selected type are generated for the measures available in the Associated Measures list. Figure 3, Figure 4, and Figure 5 depict this process clearly.
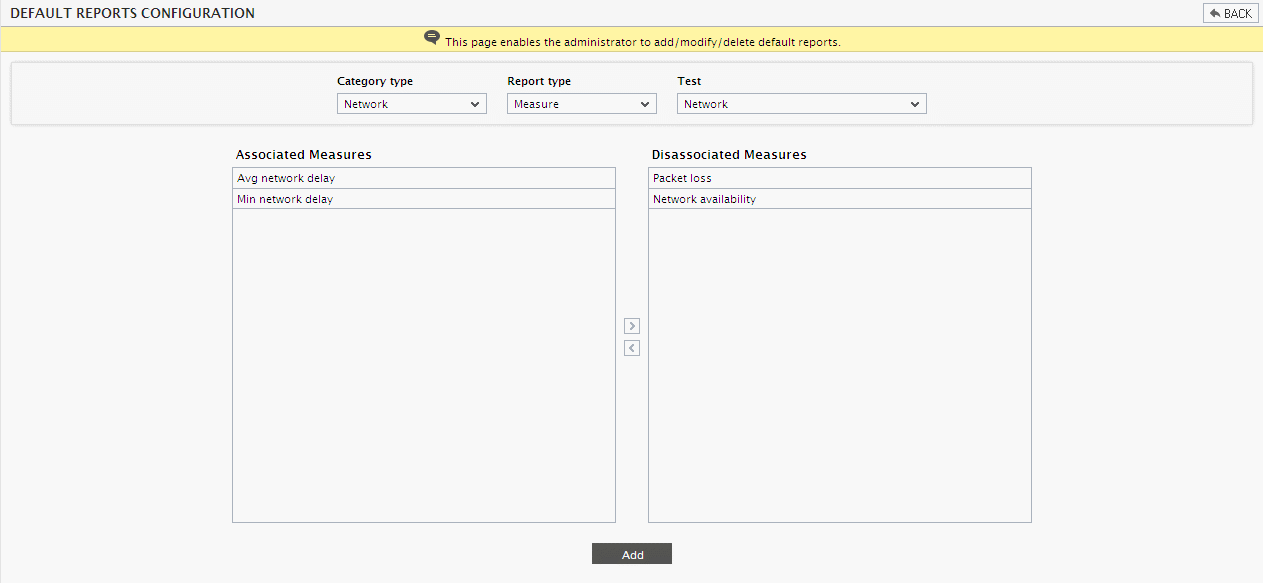
Figure 4 : Associating the measures with the specified report type
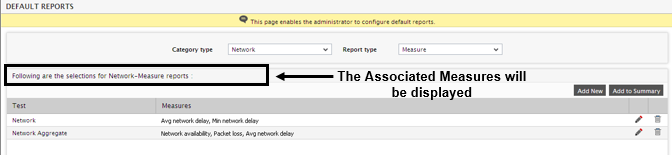
Figure 5 : Updating the association for a default network report
- Upon updating, the associated measures will be displayed as indicated by Figure 5. In the example depicted by Figure 6, Avg network delay and Min network delay are the measures that have been chosen for generating default Network-Measure reports. If summary reports are to be generated for the same set of measures, then click on the Add to Summary button in Figure 5.
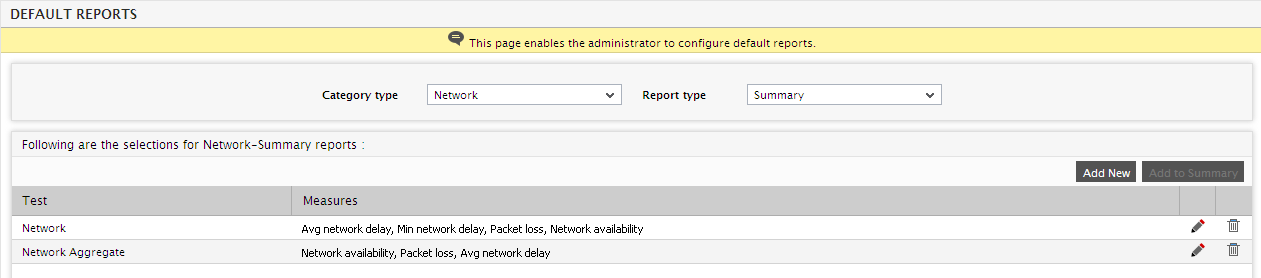
- However, in our example, the Avg network delay, Min network delay, Availability, and Packet loss are the measures that have been chosen for generating default Network-Summary reports (see Figure 5).
- Settings so updated can be deleted using the
 button.
 - Clicking the
 icon against the Test section will help you modify your selection. Now, to disassociate the measures of your choice, select them from the Associated Measures list, click on the > button, and finally, click on the Add button.
System Reports
This category illustrates various reports of operating-system level metrics such as CPU, memory, and disk usage.
For configuring reports of the System category, select the System option and proceed in the same manner as discussed above. Figure 7 depicts the process.
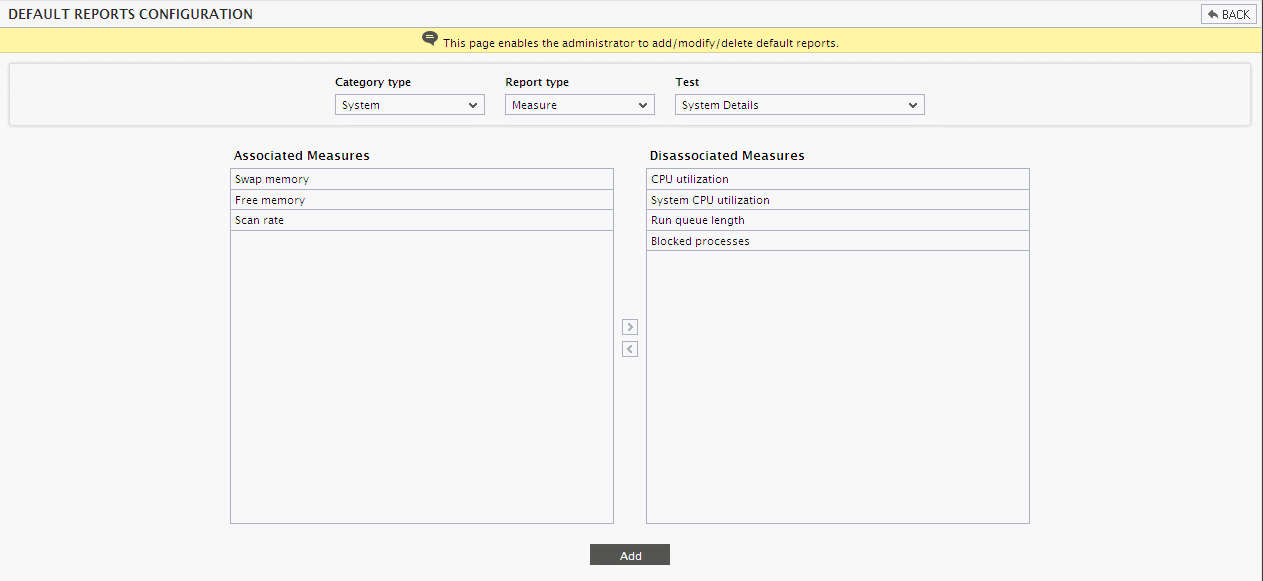
Figure 7 : Specifying the measures for which default system reports are to be generated
In the example illustrated by Figure 7, note that three measures pertaining to the System Details test, namely, Swap memory, Free memory and Scan rate, have been chosen for generating System-Measure reports. If summary reports are to be generated for the same set of measures, then click on the Add to Summary button in Figure 5.
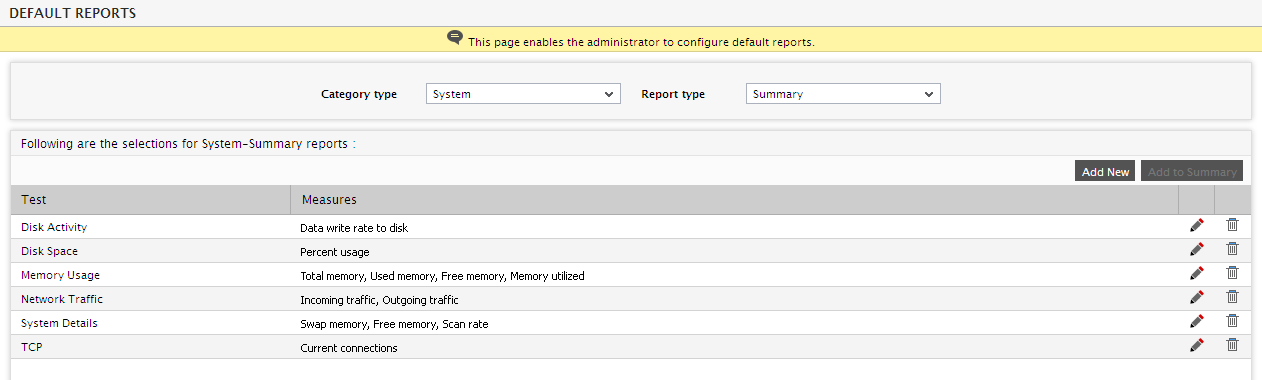
Figure 8 : Clicking the Add to Summary button for generating the System Summary Reports
Application Reports
Application reports offer insights into an application’s performance. Different reports can be configured and provided for each application.
For configuring reports belonging to the Application category, select the Application option and proceed as follows:
- Select a Report type from the list box (see Figure 9).
- Then, for generating reports for measures associated with a particular component type, select a type of component from the Component type list box (see Figure 9).
- The Test list box will then be populated with all the tests associated with the selected component type. From this list box, select the test that generates the measures for which reports are required (see Figure 9).
- Once a test is selected, all the measures associated with the selected test will appear in the Disassociated Measures list (see Figure 9).
- Then, from the Disassociated Measures list, select the measures for which reports of the selected type are to be generated (see Figure 9). Next, click on the < button to transfer the selected measures to the Associated Measures list. Then, click on the Add button. This ensures that reports of the selected type for the chosen component type are generated for the measures available in the Associated Measures list (see Figure 9).
-
Similarly, measures associated with multiple tests can be chosen for report generation (see Figure 10). Finally, click on the Update button.
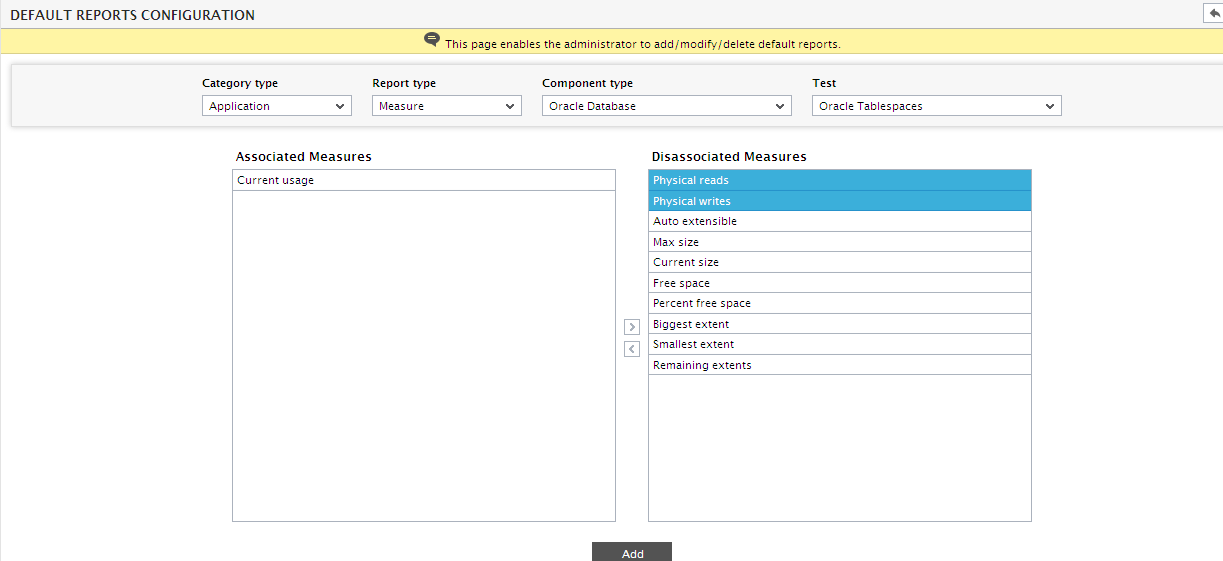
Figure 9 : Specifying the measures for which default application reports are to be generated
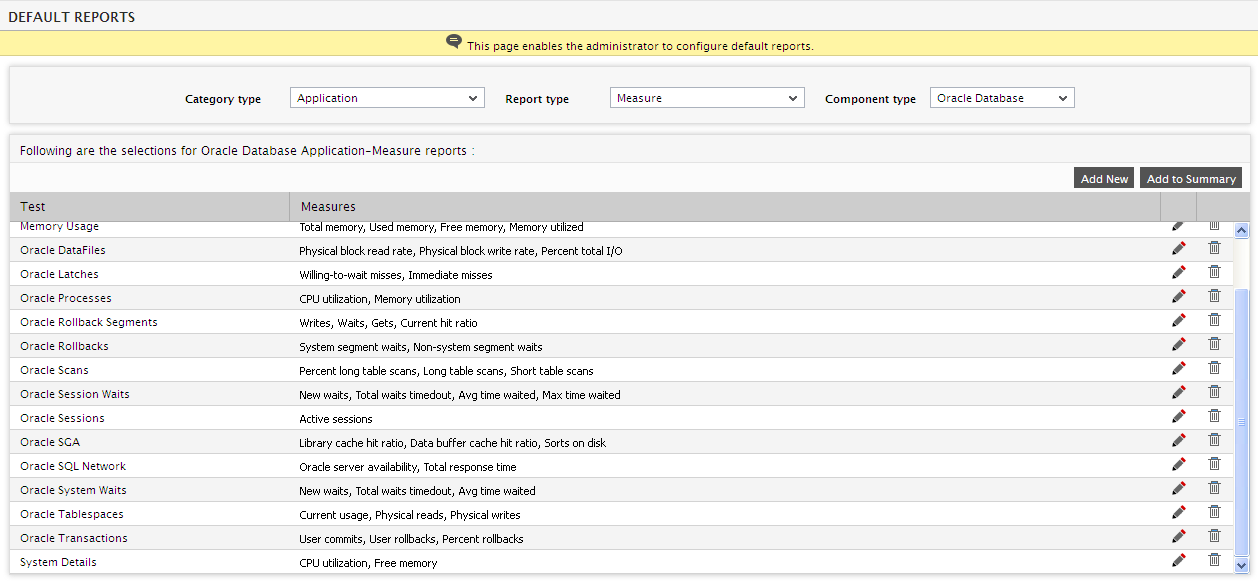
Figure 10 : List of measures for which default application reports are to be generated
- In the example illustrated by Figure 9 and Figure 10, note that a host of measures for the tests related to the Oracle Database have been included along with the Physical writes and Physical reads measure associated with the Oracle TableSpaces test, for generating default Application-Measure reports. If summary reports are to be generated for the same set of measures, then click on the Add to Summary button in Figure 10.
- Settings so updated can be deleted using the button.
- Now, to disassociate the measures, select them from the Associated Measures list, click on the > button, and finally, click on the Add button.
Site Reports
Performance metrics relating to different web sites can be plotted in the Site category.
For configuring reports belonging to the Site category, select the Site option and proceed in the same manner as discussed for Network reports. Figure 11 depicts this process.
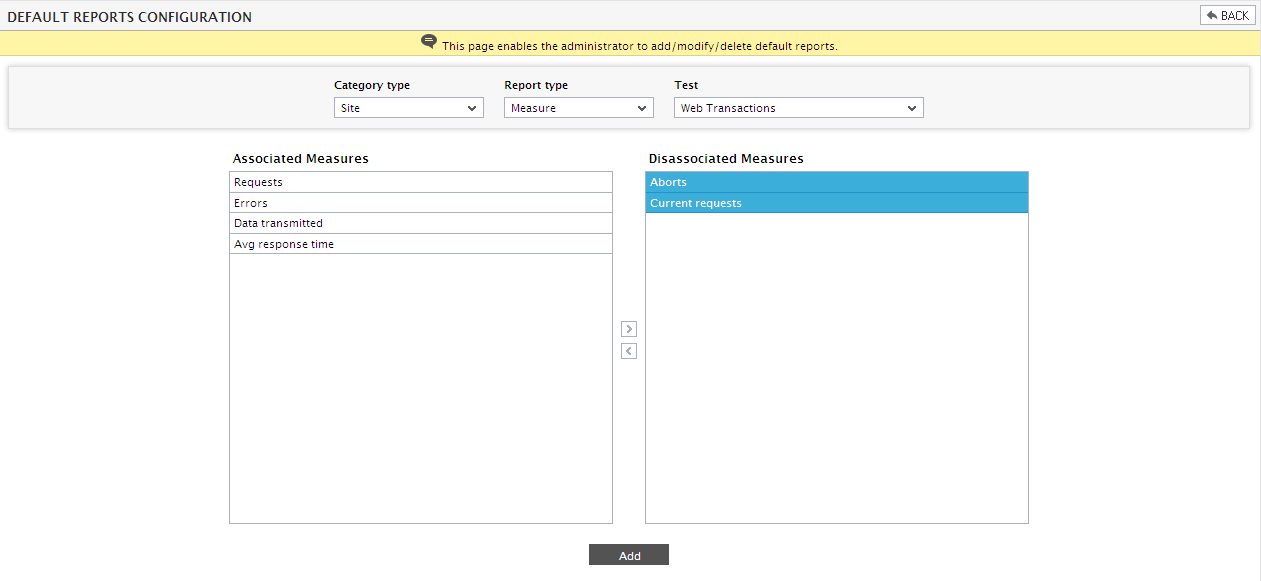
Figure 11 : Specifying the measures for which default service reports are to be generated
According to Figure 11, two measures pertaining to the Web Transactions test, namely, Aborts and Current requests measures, have been chosen for generating default Site-Measure reports. If summary reports are to be generated for the same set of measures, then click on the Add to Summary button in Figure 12.
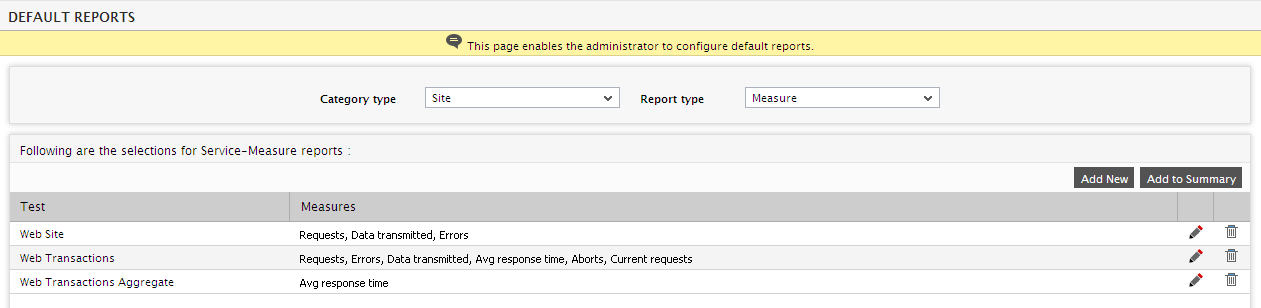
Figure 12 : Adding the measures to generate the Site specific Summary reports