Live Graph Display
Administrators of large, mission-critical environments are expected to be on high vigil 24 x 7, as even seemingly minor aberrations in performance could prove to be fatal for the infrastructure. Particularly, critical components of such infrastructures demand continuous attention. Therefore, it is essential for the monitoring solution in use to report even the smallest of variations in performance of such components, in real-time. Towards this end, the eG monitoring suite provides the live graph display option which displays real-time graphs of key performance metrics relating to critical components in the infrastructure, allowing the administrator to keep a constant watch on the measure behavior, observe variations in the measures as they occur, and detect anomalies on-the-fly. Besides, eG Enterprise provides the option to plot historic data alongside the current data in the graph, so that an effective comparison of the past and the present performance can be performed, and appropriate performance decisions can be easily taken.
To view the live graphs, select the Live option from the Graphs tile in the eG monitor interface.
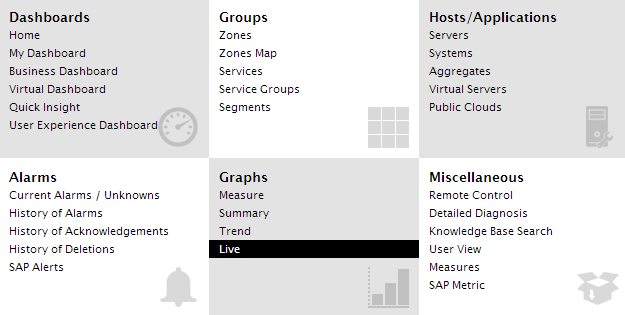
Figure 1 : Selecting the LIVE option
If custom views for the live graphs pre-exist, then, when the live option is clicked, the graphs configured for that custom view which has been set as the default view, will appear. If only one custom view has been defined so far, the eG Enterprise system will automatically set this view as the default view and display the graphs configured for it. If no custom views have been configured yet, then a message to that effect will appear.
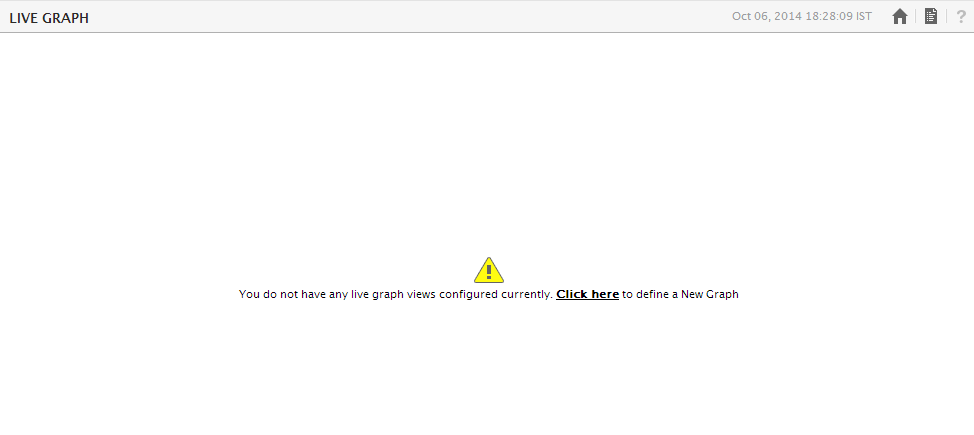
Figure 2 : The message indicating that no custom views exist
To create a new view, click on the Click here hyperlink in . will then appear allowing you to configure the new custom view.
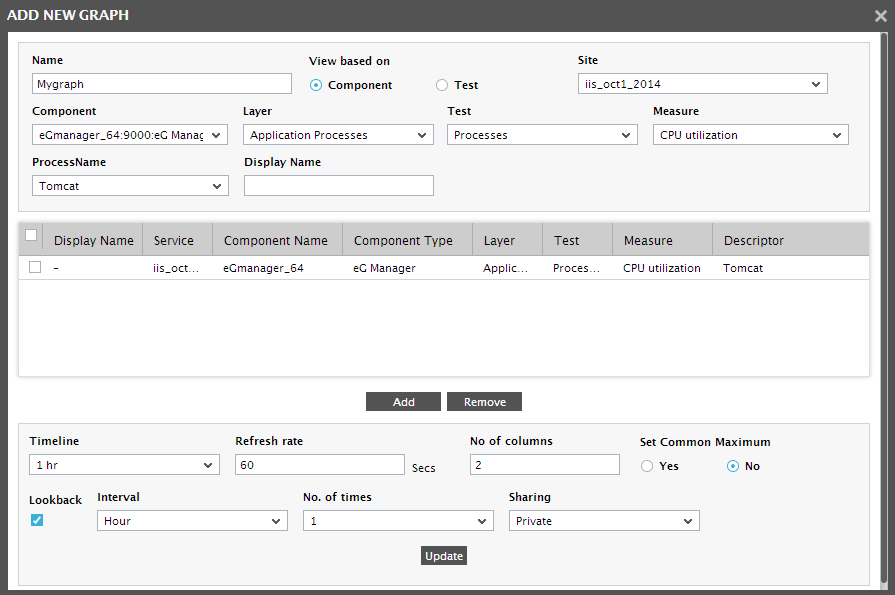
Figure 3 : The CONFIGURE GRAPH page with the Component option chosen
To configure the graphs to be associated with the new view, do the following:
- Provide a Name for the view.
-
Next, select the criterion based on which your view is to be designed. A view can be built on a Component or a Test basis. Select the Component option if you want to search for and pick those measures that are reported by the tests executing on a specific component(s). Then, proceed as follows:
- If the measure to be plotted live pertains to a particular site, then select the site from the Service list box of Figure 4. This is an optional field, and will appear only if at least one service is configured in the environment.
- If a Service is selected, the components associated with that service will appear in the Component list box. If no service is selected, then all managed components in the environment will appear in the Component list box. Choose the component for which a measure graph needs to be generated.
- The layers of the chosen component will then be listed by the Layer drop-down list box. From this list box, select the layer with which the measure of interest is associated.
- The Test list box will then be populated with the tests mapped to the chosen Layer. Select the test which collects the performance metric(s) to be plotted in the graph.
- From the Measure list box that lists all the measures that are reported by the chosen Test, pick the measure for which a graph is to be generated.
- If the test that was selected previously takes descriptors, then select a descriptor from the next list box – the descriptor type will be the label of this list box. For instance, if the chosen test takes disk partitions as descriptors, then the label will be DiskDrive. To include all the descriptors in a single graph of the chosen measure, select the All option from this list box.
- An appropriate Display name for the measure can then be provided.
- Then, add the specification by clicking on the add button in Figure 5.
-
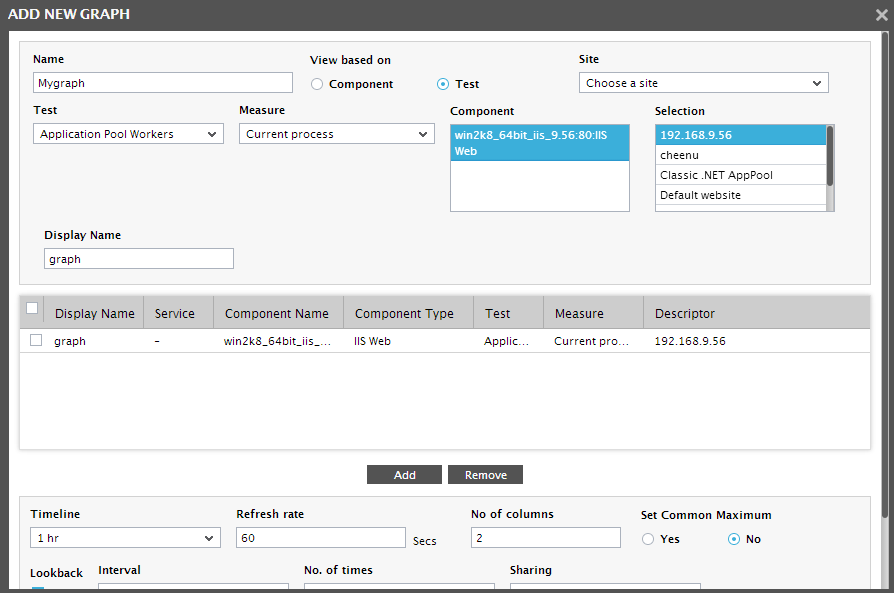
Alternatively, you can use the Test option against View based on to monitor multiple components on which a particular test executes. Once the Test option is selected, proceed as discussed hereunder:
- If the measure to be plotted live pertains to a particular site, then select the site from the Service list box of Figure 4.99. This is an optional field, and will appear only if at least one service is configured in the environment.
- If a Service is selected, then all the tests associated with the components under the chosen service will appear in the Test list box. Choose the Test for which a measure graph needs to be generated.
- From the Measure list box that lists all the measures that are reported by the chosen Test, pick the measure for which a graph is to be generated.
- Next, choose a component from the Component list, and then pick the descriptors for which the graph is to be generated from the Selection list. To include all the descriptors in a single graph of the chosen measure, select the All option from this list box.
- An appropriate Display name for the specification can then be provided.
-
Then, add the specification by clicking on the add button in Figure 4.
-
Similarly multiple measures can be added (see Figure 4 and Figure 4).
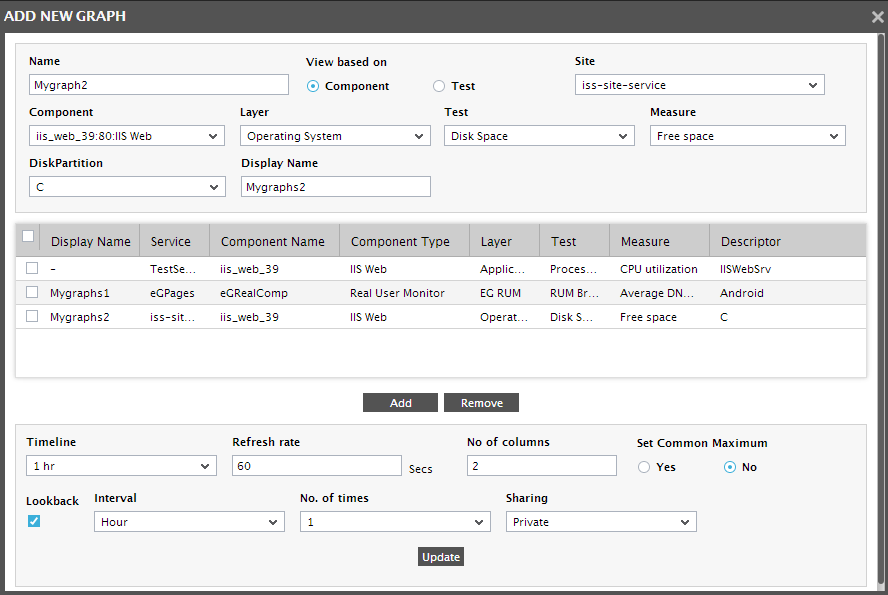
Figure 5 : Multiple specifications in a Component-based view
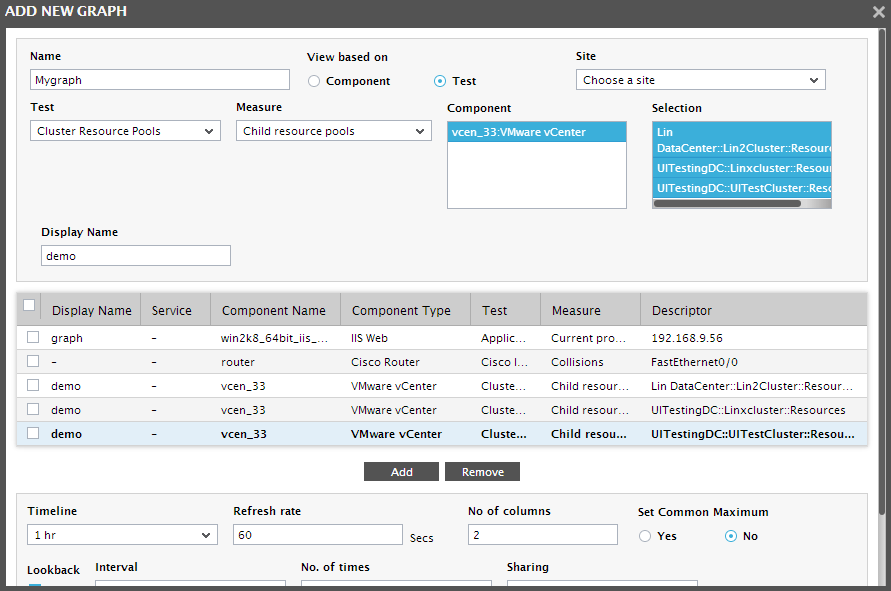
Figure 6 : Multiple specifications in a Test-based view
- To delete a measure, select the corresponding entry from the list box adjacent to the add button and click the delete button.
- Next, select a Timeline for the graphs, and specify how frequently the measure values are to be refreshed in the Refresh Rate (see or Figure 7) text box.
- The live graph display page will display a measure graph for every measure chosen in Figure 4 or Figure 3. These graphs will be displayed in a tabular format, characterized by rows and columns. Every graph will occupy a particular cell in the table. By default, the graph display will contain 2 rows and 2 columns.
- Next, if you want the measure graph to plot the past values too, select the Lookback check box.
- By default, the Set Common Maximum flag is set to NO. This indicates that by default, eG Enterprise does not set a common maximum value for all graphs in a view - in other words, the maximum value differs from graph to graph. This is because, the suite, by default, determines the maximum value for a graph by comparing all the values reported by its corresponding measure during the specified Timeline. If you want to set a common maximum value across all graphs in a view, set the Set Common Maximum flag to YES.
- If the Lookback option is chosen, then proceed to select an Interval for the past values. For example, if the Timeline for the current measures is set to 1 hour, then the current measure graph will be plotted for the last one hour - say, for 12.00 PM to 1.00 PM of February 22, 2005. If the Interval is set to 1 day, then eG Enterprise will plot the values reported between the same hour (i.e., 12.00 PM and 1.00 PM), but for the previous day - i.e., February 21, 2005.
-
Optionally, you can pick the Others option from the Interval list and then choose a fixed timeline from the drop-down list that appears alongside (see Figure 9); for instance, you can select Others from the Interval list and then pick 3 hrs from the drop-down list that appears alongside. This will result in a live graph in which the past 3 hours of data is plotted.

Figure 7 : Choosing the 'Others' option from the 'Interval' list
To view meaningful data, it is recommended that the Interval set for the past values be greater than or equal to the Timeline chosen for the current values.
-
The number of past measurements to be plotted can be specified in the No. of Times text box. In the example above, if 2 is specified against the No. of Times text box, then the measure graph will plot 2 sets of past measurements. This includes:
- The values for 12.00 PM to 1.00 PM on the February 21, 2005
- The values for 12.00 PM to 1.00 PM on the February 20, 2005
Note:
If the All option is chosen from the list of descriptors, then the Lookback check box and its related options, such as the Interval and No. of Times fields, will become disabled.
-
To facilitate collaboration and knowledge sharing among administrators, eG Enterprise now allows users the flexibility to share useful live graph views they create with other users. For sharing a view, you need to first set a share type by selecting the desired option from the Sharing list box in . The options are as follows:
- Private: If you set a view as Private, then all other users to the eG Enterprise system will be denied access to that view. Only the creator of the view will be able to access the view.
-
Public: If you set the view as Public, then only users with the following rights will have access to that custom view:
- Users with access to all the managed components in the environment
- Users with access to one/more components that are included in the view being shared
Note:
- If a view has been granted Public access, then users with the privilege to monitor only a few components in that view will be able to take a look at only those graphs in the view that pertain to the components in his/her monitoring scope.
-
Assume that a web site service, www.abc.com, has been configured, which is supported by an IIS Web server and an Oracle Database server. Say, a user john is created, who is allowed to monitor only the Oracle Database server that is involved in delivering www.abc.com. Assume that a live graph view is then designed by first selecting the Site www.abc.com, and then selecting key metrics from each of the components that are supporting the site. If this view is allowed Public access, then user john will not be able to access the view at all. This is because, the live graph view that was shared was designed using the Site www.abc.com as the base. User john does not have access rights to the site www.abc.com. Therefore, eG Enterprise denies user john access to the site-based view.
On the other hand, if the live graph view was designed by directly selecting the IIS Web and Oracle Database components (involved in service delivery) from the Component list, then such a view can be accessed by user john. In this case however, note that user john will be able to view only the live graphs pertaining to the Oracle Database server assigned to him, and not the IIS Web server.
- If a view has been allowed Public access, then users whose monitoring scope does not include any of the components in that view will not be allowed access to the view.
-
Share: On the other hand, if you choose the Share option from the Sharing list, then you can pick and choose the users who need to be granted access to that view. To map users to a view, do the following:
- Select the users to be granted access from the Available Users list box.
- Then, click on Add selected (
 ) icon to grant the selected users access to the view. Doing so shifts the selection to the Selected Users list.
 - To revoke the access permission granted to a user, you can select the user from the Selected Users list, and click the Remove from selected (
 ) icon.
 -
Finally, click on Update to save the changes.
Note:
- A user without access to Live Graphs cannot view any of the views shared with him/her.
- A view can be modified / deleted only by the user who creates it. The shared users on the other hand, can only view the live graphs, and cannot modify/delete the view.
- If a user has been granted Share access to a view, but he/she has the right to monitor only a few components that are included in the view, then such a user will be able to take a look at only those graphs in the shared view that pertain to the components in his/her monitoring scope.
-
Assume that a web site service, www.abc.com, has been configured, which is supported by an IIS Web server and an Oracle Database server. Say, a user john is created, who is allowed to monitor only the Oracle Database server that is involved in delivering www.abc.com. Assume that a live graph view is then designed by first selecting the Site www.abc.com, and then selecting key metrics from each of the components that are supporting the site. If this view is allowed Share access, then user john will not be able to access the view at all. This is because, the live graph view that was shared was designed using the Site www.abc.com as the base. User john does not have access rights to the site www.abc.com. Therefore, eG Enterprise denies user john access to the site-based view.
On the other hand, if the live graph view was designed by directly selecting the IIS Web and Oracle Database components (involved in service delivery) from the Component list, then such a view can be accessed by user john. In this case however, note that user john will be able to view only the live graphs pertaining to the Oracle Database server assigned to him, and not the IIS Web server.
- If a user has been allowed Share access to a view, but he/she does not have the privilege to monitor any component included in the view, then such a view, despite being shared, will not be available to that user.
- Finally, click on the update button to register the changes.
-
Clicking on the Update button will open the live graph display page that displays the configured measure graphs (see Figure 8).
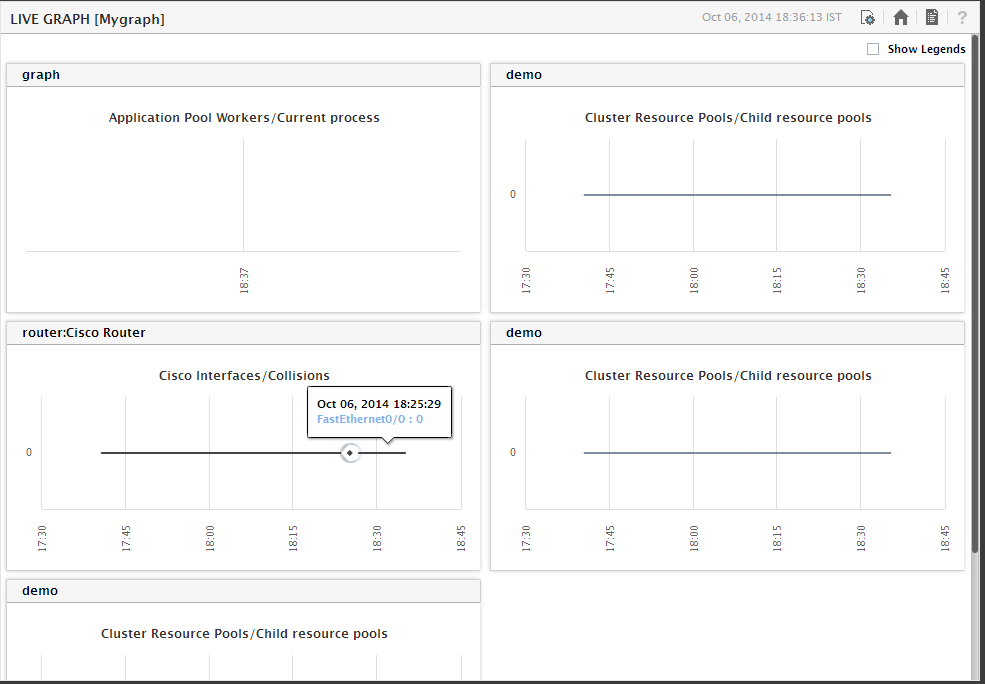
- If the values reported for a large number of descriptors are plotted in a single graph, the graph would naturally appear cluttered. To view and analyze such live graphs more clearly, just click on the corresponding graph title or on the graph itself. This will automatically enlarge the graph, thus enabling you to view it more clearly.
- To make changes to the configuration, click on the views button in the Live Graph menu at the right top corner of Figure 8.
-
Figure 8 will appear displaying the complete list of custom views (including the newly configured view).
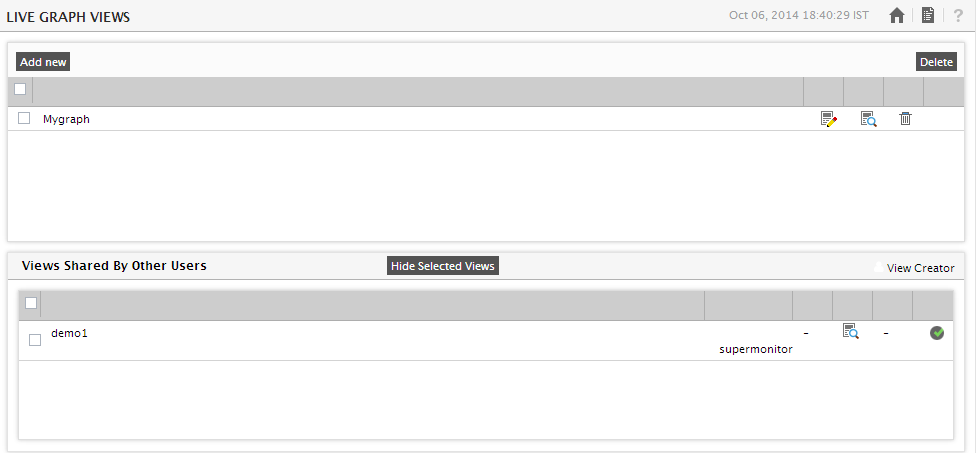
- To add a new view, click the Add New button in Figure 9. To set any of the listed views as the default view, click the Set As Default (
 ) corresponding to the view name in Figure 9. To delete a view, select the check box corresponding to the view name in Figure 9, and click the delete (
 )icon. Choose Select All and then click the Delete button, if all the listed views need to be deleted.
 - To make changes to the custom view configurations, click on the
 icon against a view in Figure 9. This will lead you back to Figure 9 where such configurations can be performed. However, in the modify mode, you cannot change the name of the custom view. Moreover, an additional delete button will appear in Figure 9, which will allow you to delete the entire configuration.
 - To view the configured graphs in real-time, click the View option against the view name in Figure 9. This will take you to Figure 9 once again.
- If other users have shared their views with you, then those views will be listed separately in the Views Shared by other Users section as depicted in the Figure 9.
- Against every shared view, this section also displays the name of the view creator - i.e., the user who originally created the view and shared it with the current user. This user is represented by a user icon (
 ).
). - To hide the unnecessary shared views select the views you want to hide by providing checkmark in the corresponding checkboxes.
- Now click on Hide Selected Views. Doing so ensures that the chosen views are hidden as depicted in the Figure 9.