System Analysis – By Service Report
If your mission-critical services often fail owing to resource constraints, you may want to historically analyze the resource usage of the systems hosting those applications that are engaged in the delivery of these services to identify resource usage bottlenecks (if any). The System Analysis Report for a particular Service aids this usage analysis. For a chosen service, this report will help you understand how each system supporting that service has been utilizing the physical resources available to it, determine whether usage increased sporadically or consistently, and identify those systems that frequently ran out of resources, causing the service quality to dip that very often. This way, you can quickly point to the systems that are candidates for resizing and those resources on the system that are limiting its performance. These systems and resources will hence be the focal point of future capacity plans.
To generate a System Analysis - By Service report for a chosen service in your environment, do the following:
- Login to eG Reporter.
- Follow the menu sequence: REPORTS BY FUNCTION -> Analytical Reports -> System Analysis -> By Service.
-
Figure 1 will then appear.
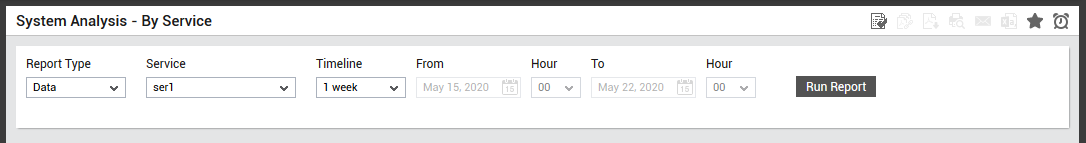
- By default, Data option will be chosen from the Report Type list indicating that the generated report will be in a tabular format. However, if you wish to generate the report in a graphical format, then, select Graph option from this list.
- Select a service for which this report is to be generated from the Service list.
-
Provide a Timeline for the report.
Note:
For every user registered with the eG Enterprise system, the administrator can indicate the maximum timeline for which that user can generate a report. Once the maximum timeline is set for a user, then, whenever that user logs into eG Reporter and attempts to generate a report, the Timeline list box in the report page will display options according to the maximum timeline setting of that user. For instance, if a user can generate a report for a maximum period of 3 days only, then 3 days will be the highest option displayed in the Timeline list - i.e., 3 days will be the last option in the fixed Timeline list. Similarly, if the user chooses the Any option from the Timeline list and proceeds to provide a start date and end date for report generation using the From and To specifications, eG Enterprise will first check if the user's Timeline specification conforms to his/her maximum timeline setting. If not, report generation will fail. For instance, for a user who is allowed to generate reports spanning over a maximum period of 3 days only, the difference between the From and To dates should never be over 3 days. If it is, then, upon clicking the Run Report button a message box will appear, prompting the user to change the From and To specification.
-
In addition to the settings discussed above, this report comes with a set of default specifications. These settings are hidden by default. If you do not want to disturb these default settings, then you can proceed to generate the report by clicking the Run Report button soon after you pick a Measure. However, if you want to view and then alter these settings (if required), click on the
 icon. The default settings will then appear in the MORE OPTIONS drop down window (see Figure 2). The steps below discuss each of these settings and how they can be customized.
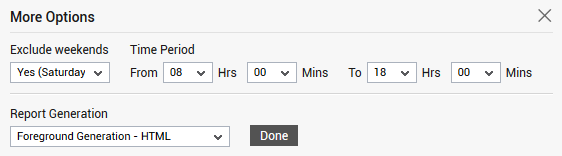
Figure 2 : The default settings for generating the report for a chosen service
- If the timeline specified for the report needs to exclude the data collected during the Weekends, then set Exclude weekends to Yes. If not, select No.
-
Next, specify the start time and end time for report generation against the Time period field.
Note:
The default Time period to be displayed here can be configured using the consolidated reports page in the eG administrative interface; to access this page, follow the menu sequence: Settings -> Reporter -> Consolidated Reports. For more details regarding this page, refer to Section Consolidated Reports of this manual.
-
In large environments, reports generated using months of data can take a long time to complete. Administrators now have the option of generating reports on-line or in the background. When a report is scheduled for background generation, administrators can proceed with their other monitoring, diagnosis, and reporting tasks, while the eG manager is processing the report. This saves the administrator valuable time. To schedule background processing of a report, you can either select the Background Save - PDF option or the Background Save - CSV option from the Report Generation list. In this case, a Report Name text box will appear, where you would have to provide the name with which the report is to be saved in the background. To process reports in the foreground, select the Foreground Generation - HTML option from this list.
Note:
- The Report Generation list will appear only if the EnableBackgroundReport flag in the [BACKGROUND_PROCESS] section of the eg_report.ini file (in the [EG_INSTALL_DIR]\manager\config directory) is set to Yes.
- The default selection in the Report Generation list will change according to the Timeline specified for the report. If the Timeline set is greater than or equal to the number of days specified against the MinDurationForReport parameter in the [BACKGROUND_PROCESS] section of the eg_report.ini file, then the default selection in the Report Generation list will be Background Save - PDF. On the other hand, if the Timeline set for the report is lesser than the value of the MinDurationForReport parameter, then the default selection in the Report Generation list will be Foreground. This is because, the MinDurationForReport setting governs when reports are to be processed in the background. By default, this parameter is set to 2 weeks - this indicates that by default, reports with a timeline of 2 weeks and above will be processed in the background.
- Finally, click the Run Report button to generate the report.
-
If the Foreground Generation - HTML option is chosen from the Report Generation list and Data option is chosen from the Report Type list, then, Figure 3 will appear as soon as the Run Report button is clicked.
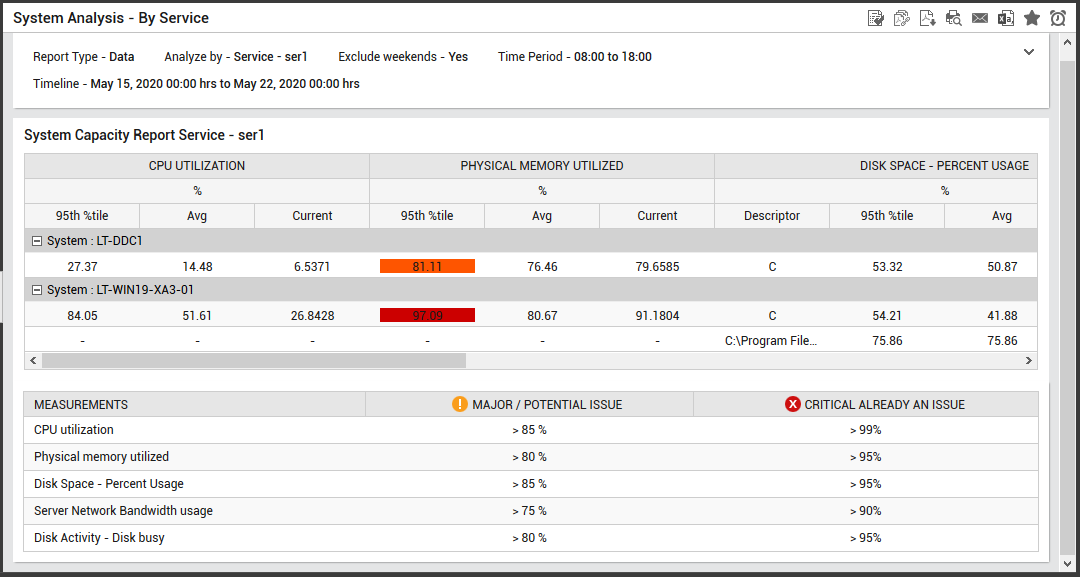
Figure 3 : The generated System Analysis - By Service report
- For each service chosen, this report will display the systems that are associated with that service. Against each system, the report will display the Avg, Current and the 95th percentile value of CPU usage, memory usage, bandwidth usage, disk space usage, and the level of disk activity of that system during the given timeline. The Avg value, the Current value and the Percentile value will be reported for each descriptor of the application/system. Using this report, you can easily understand the variations in the behavior of the measure over time, and accordingly plan the future capacity of the application/system.
-
If the Foreground Generation - HTML option is chosen from the Report Generation list and Graph option is chosen from the Report Type list, then, Figure 4 will appear as soon as the Run Report button is clicked.
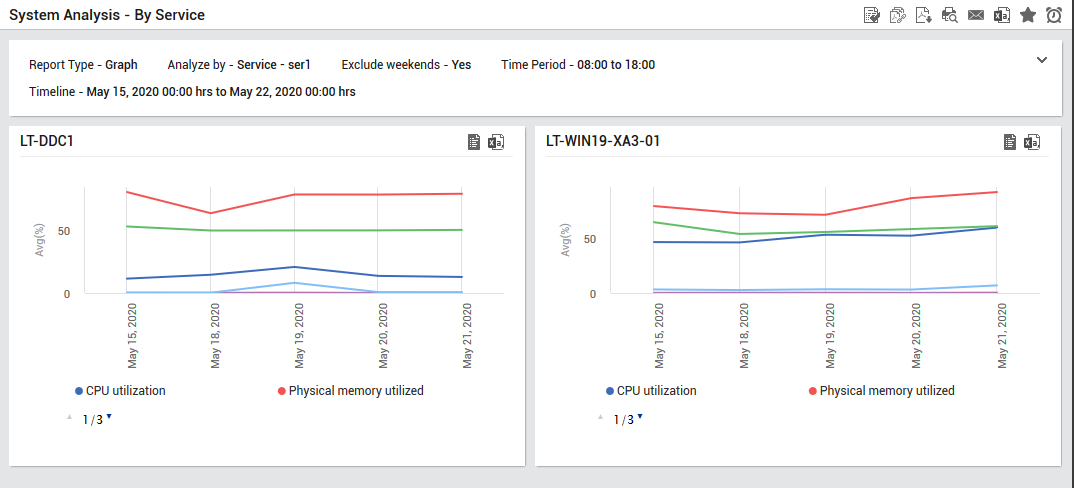
- The report displays the 95th percentile value, the Current value and the Avg of CPU usage, memory usage, bandwidth usage, disk space usage, and the level of disk activity on the systems hosting the chosen components. The pre-configured thresholds governing the 95th percentile value are indicated in the section at the bottom of the report. These thresholds can be configured using the Capacity Planning System Report Settings section that can be accessed through the Settings-> Reporter-> Capacity Planning Reports -> Configure System Reports menu sequence of the Admin module. As you can see, the threshold limits set for each measure has been indicated in the report using which you can analyze the abnormalities easily. This way, the report helps you recognize situations in the past when resource usage touched unacceptable limits, analyze whether a change in capacity can help prevent such excesses, and accordingly plan the future capacity of your critical systems.
- If the Background Save - PDF option is chosen from the Report Generation list, then clicking on the Run Report button will not generate the report and display it in this page for your benefit. Instead, a message indicating that the report is being processed in the background will appear. This will be accompanied by a link that will lead you to the page that lists all the reports that are being processed in the background, and their current status. If background report generation fails for a report, you can regenerate that report using this page, or can even delete that report if need be. On the other hand, if background processing successfully completes for your report, then, you can view a PDF of the report by clicking on the
 icon in that page.