Incident Management Dashboard
The Incident Management Dashboard provides a centralized interface for monitoring and managing alarms generated in the target environment. This dashboard enables administrators to maintain real-time visibility into components' health, prioritize incidents, and perform faster root-cause analysis. By consolidating alarms and metrics in one view, this dashboard supports efficient troubleshooting and helps prevent minor issues from escalating into critical outages. This dashboard is organized into three distinct tabs:
Alarms - Displays active alarms to track ongoing issues.
Metrics - Shows the history of alarms during the configured duration.
Unknown Alarms - Lists unclassified alarms that require further investigation.
To access the Incident Management dashboard, click on the  icon available in the Monitor tab. Then, select the Incident Management option in the Alarms tile.
Alarms
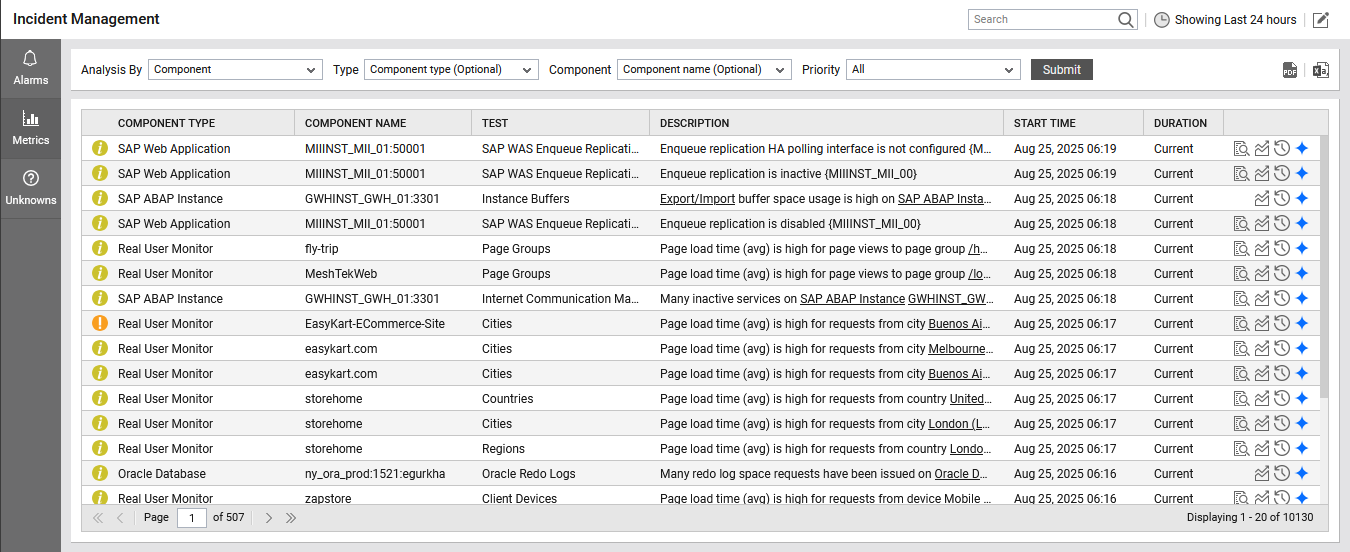
By default, the Alarms tab page will be displayed as soon as you access the Incident Management dashboard (see Figure 2):
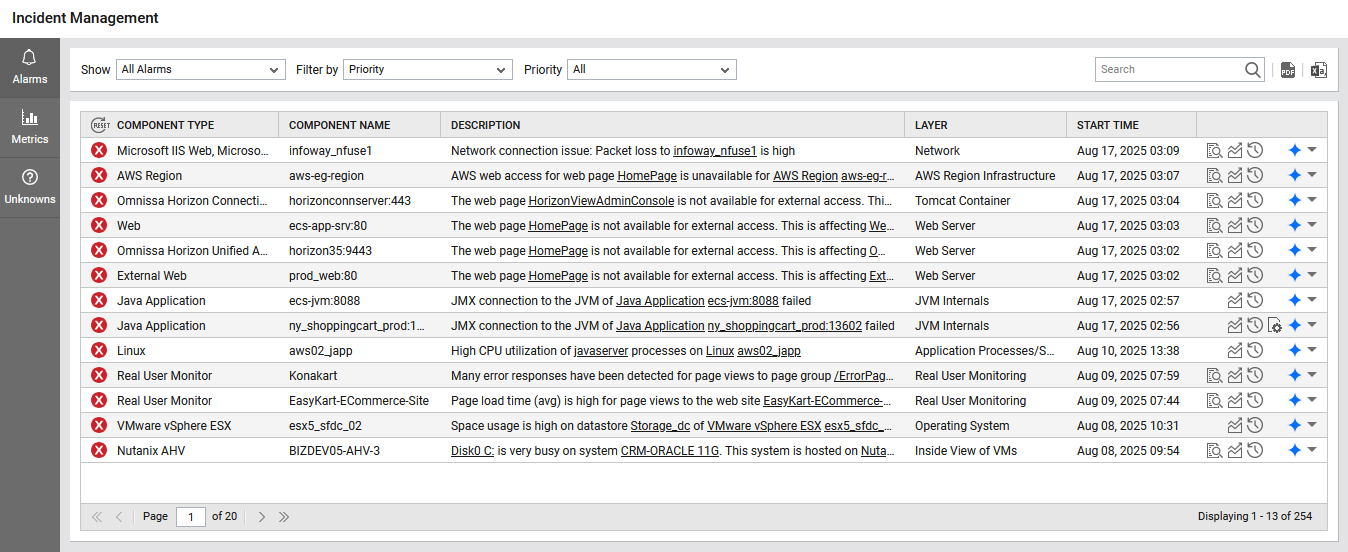
Figure 2 : The Incident Management dashboard
-
The Alarms tab lists all alarms raised for all managed components in the target environment (see Figure 2). If required, you can build filter conditions using this page so that, you can selectively view the alarms.
-
The first step towards building these filter conditions is selecting a basis for the filter. The Show drop-down list provides the filter options for viewing alarms in the Alarms tab. By default, the All Alarms option is selected from this list indicating that details of all alarms will be displayed in this tab. However, you can select other options discussed below as per your interest:
-
All Alarms with Correlation – selecting this option will list the correlated alarms that are grouped together to show dependencies or root cause.
-
Acknowledged Alarms – selecting this option will show the alarms that administrators have already acknowledged.
-
Unacknowledged Alarms – selecting this option will list the alarms that have not yet been acknowledged.
-
-
Next, pick an option from the Filter By list to filter the alarms based on its Priority, Component Type, Services, Segments and Zones. The options available here are as follows:
-
Priority - By default, the Priority option is selected from the Filter By list indicating that the alarms are listed based on their priority, with critical alarms listed at the top. When the Priority option is selected, a Priority list appears, allowing you to filter alarms by a specific priority. By default, the Priority list is set to All indicating that the alarms of all priorities are listed by default (see Figure 2). However, you can choose the priority of your interest to view only the corresponding alarms. For example, if you wish to view the major alarms, select the Major option from the Priority list and the major alarms will be displayed as shown in Figure 3.
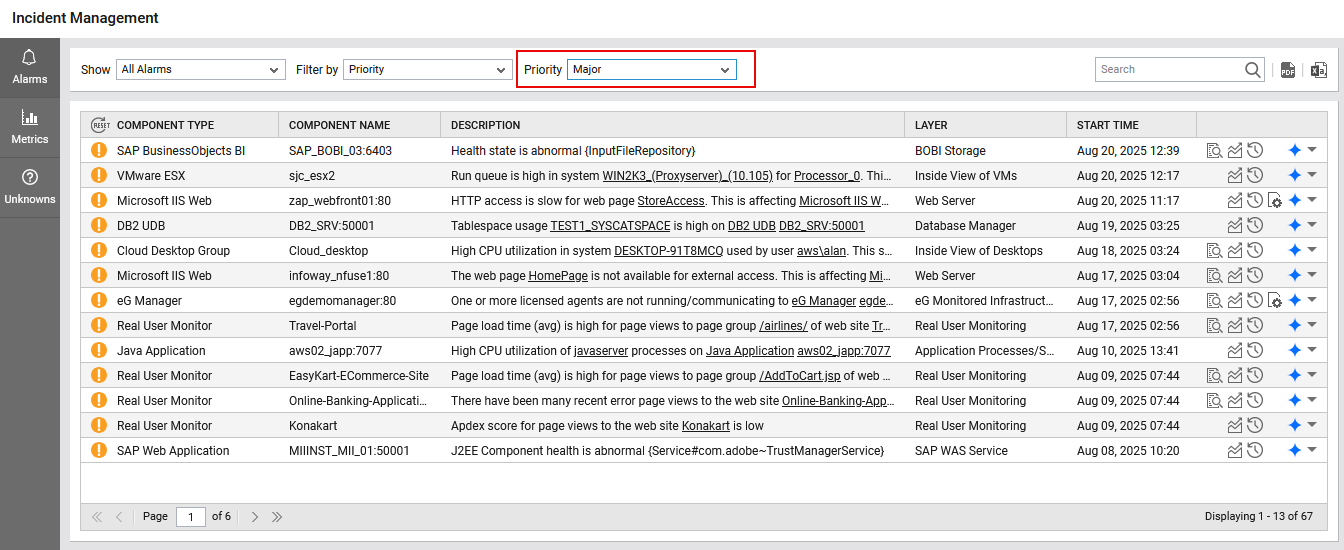
Figure 3 : The alarms listed based on the chosen priority
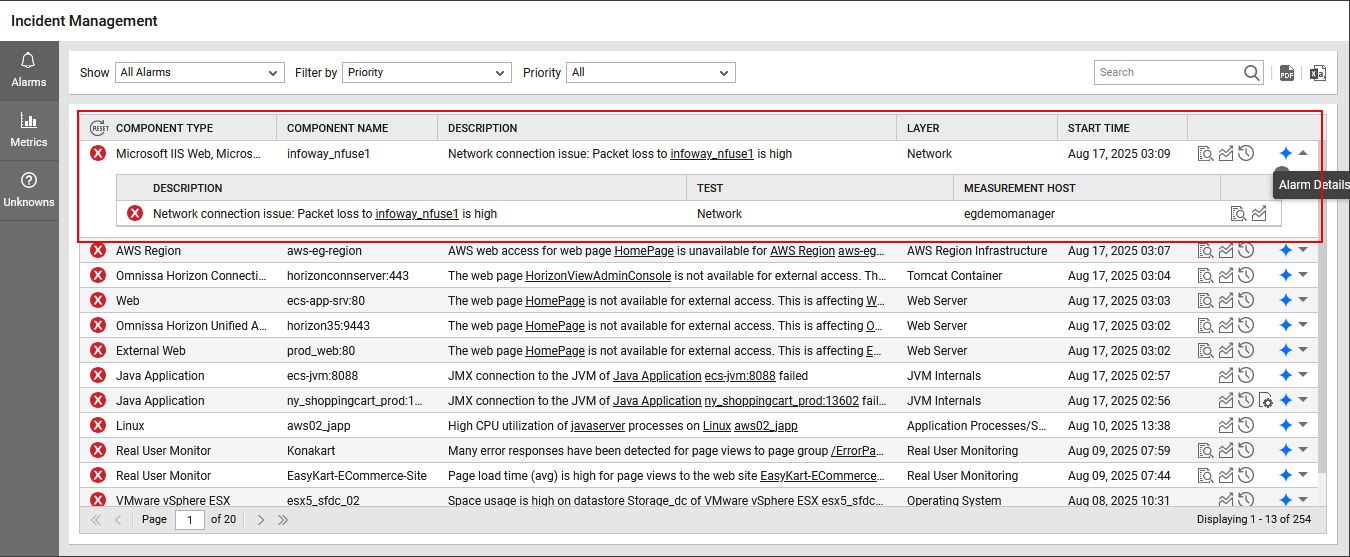
The details pertaining to every alarm such as the component type, name of the component, alarm description, name of the layer and start time of the alarms are displayed. Every row of alarm information will be accompanied by a colored indicator, that indicates the corresponding alarm priority. Critical alarms will be of the color red, major alarms will be in orange, and the minor ones come in yellow. The rows are also provided with icons for accessing the detailed diagnosis (if available) and viewing measure graphs. Additionally, a drop-down icon in each row can be expanded to display the complete details of the selected alarm as shown in Figure 4.
-
Component Type : Selecting this option from the Filter by list will invoke a Component Type list that lists all the managed component types in the environment. If you want to view the alarm history of a particular component-type, pick that type from the Component Type list, the alarms generated for the chosen component type will displayed as shown in .
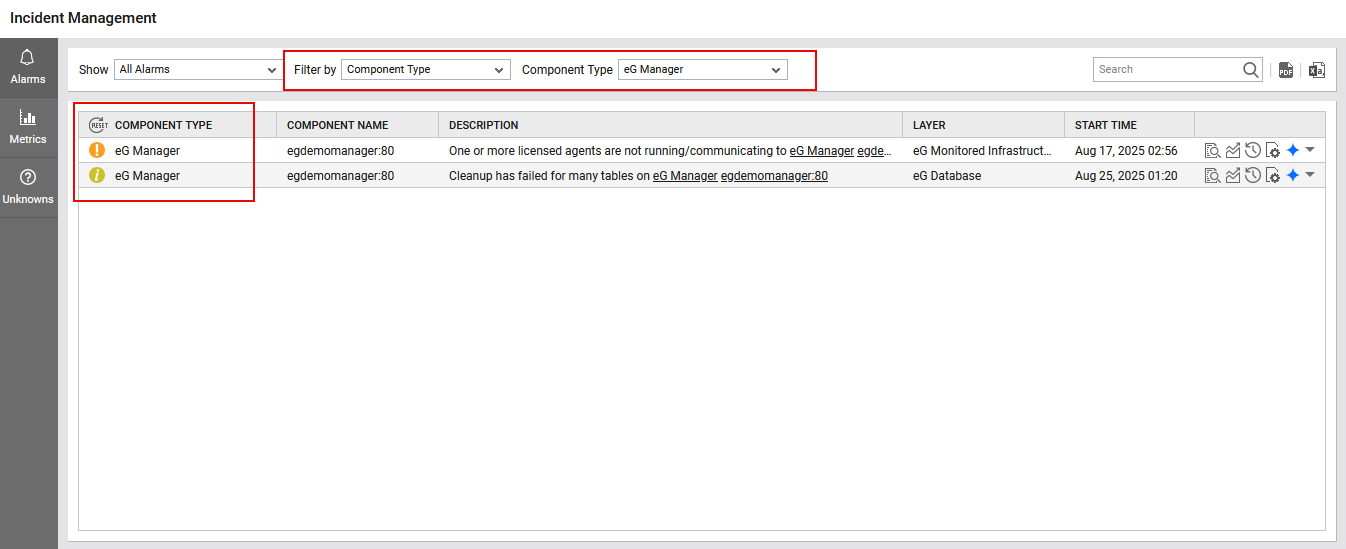
Figure 5 : Alarms displayed corresponding to the chosen Component Type
-
Zones: Selecting this option from the Filter by list will invoke a Zones list. Select a particular zone from this list, if you want to view the alarms related to that zone.
-
Segments: If this option is chosen from the Filter By list, the Segments list will additionally appear. In order to view the alarms pertaining to a specific segment, pick a segment from the Segments list.
-
Services: If this option is chosen from the Filter By list, a Services list will additionally appear. In order to view the alarm history pertaining to a specific service, pick a service from the Services list.
Note that the Zones, Segments and Services option will not be available in the Filter By list if no zones/segments/services are configured in the environment.
You can view a PDF of the dashboard by clicking on the PDF icon in the top-right corner page. You can also export the dashboard as an excel file using the CSV icon provided in the right-corner of the dashboard. Specify a part or whole name of a user in the Search text box to view the details of that particular alarm.
-
Metrics
When you select the Metrics option, you get to view the entire list of alarms pertaining to the entire infrastructure over a configured period of time as in Figure 6. By default, this page shows the alarms raised during the last 24 hours
-
By default, as soon as you access the Metrics page, you will view the alarm history of all managed components in the environment (see Figure 6). If required, you can build filter conditions using this page so that, you can selectively view the alarm history of the following infrastructure elements alone:
- Any managed component type in the environment;
- Any managed component;
- A component of a particular type;
- A specific segment / service / zone;
- A component-type that is part of a segment / service / zone;
-
A component that is part of a segment/service/zone;
-
The first step towards building these filter conditions is selecting a basis for the filter. This can be achieved by picking an option from the Analysis By list. The options available here are as follows:
-
Component : This is the default selection in the Analysis By list. Owing to this default setting, the Metrics page displays the alarm reported during the configured duration of all managed components in the environment, by default. If you proceed with the default selection, then, you will find that the Type and Component lists in Figure 6 are populated with all the managed component types and components (respectively) in the environment. If you want to view the alarms of a particular component-type, pick that type from the Type list. Likewise, if you want to view the alarms of a particular managed component, pick the name of that component from the Component list. If the Component list has too many components to choose from, then, you can condense the list by first picking a Type; this will make sure that the Component list consists of only those managed components that are of the chosen type. You can then easily pick the component of your choice from the Component list. Then, clicking the Submit button will result in an alarm history that pertains to that component alone (see Figure 7).
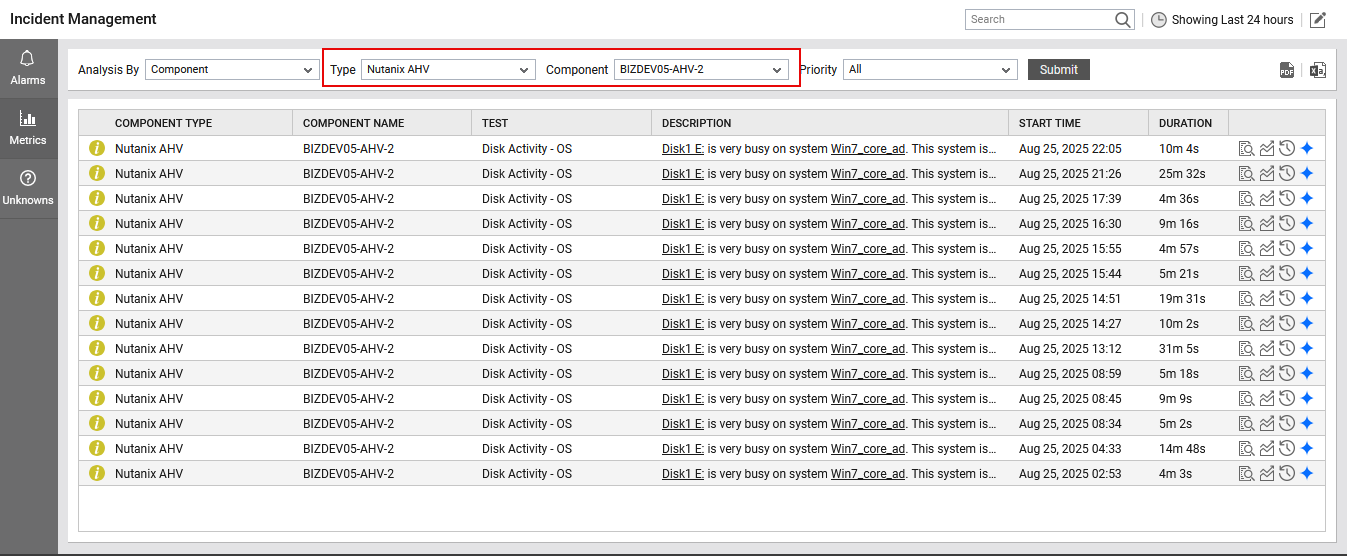
Figure 7 : Viewing the alarm history of a particular component
-
Zone: Selecting this option from the Analysis by list will invoke a Zone list. Select a particular zone from this list, if you want to view the history of alarms related to that zone. An Include Subzones flag also appears. By setting this flag to Yes, you can make sure that this page also includes those alarms that are associated with the sub-zones of the chosen zone.
Once a Zone is selected, the Type and Component lists will be populated with those types and components (respectively) that are part of the selected zone. To view the alarm history of a particular component-type that is part of a zone, pick that type from the Type list. Similarly, to view the alarm history of a component that is part of a zone, pick that component from the Component list. If the Component list still has too many components to choose from, then, you can condense the list further by first picking a Type; this will make sure that the Component list consists of those components in the selected zone that are of the chosen type. You can then easily pick the component of your choice from the Component list.
Note that the 'Zone' option will not be available in the 'Analysis By' list if no zones are configured in the environment.
-
Segment: If this option is chosen from the Analysis By list, a Segment list will additionally appear. In order to view the alarms pertaining to a specific segment, pick a segment from the Segment list.
Once a Segment is selected, the Type and Component lists will be populated with those types and components (respectively) that are part of the selected segment. To view the alarm history of a particular component-type that is part of a segment, pick that type from the Type list. Similarly, to view the alarms of a component that is part of a segment, pick that component from the Component list. If the Component list still has too many components to choose from, then, you can condense the list further by first picking a Component Type; this will make sure that the Component list consists of those components in the selected segment that are of the chosen type. You can then easily pick the component of your choice from the Component list.
Note that the 'Segment' option will not be available in the 'Analysis By' list if no segments are configured in the environment.
-
Service: If this option is chosen from the Analysis By list, a Service list will additionally appear. In order to view the alarms pertaining to a specific service, pick a service from the Service list.
Once you choose a Service, the Type and Component lists in Figure 6 will be populated with those types and components (respectively) that are engaged in the delivery of the said service. If you want to view the alarm history of a particular component-type that is part of the selected service offering, then, pick that type from the Type list. Similarly, if you want to view the alarm history of a component that supports the selected service offering, pick that component from the Component list. If the Component list still has too many components to choose from, then, you can condense the list further by first picking a Type; this will make sure that the Component list consists of those components in the selected service that are of the chosen type. You can then easily pick the component of your choice from the Component list.
Note that the 'Service' option will not be available in the 'Analysis By' list if no services are configured in the environment.
-
- You can even choose to view the details of past alarms that are of a particular priority, by selecting that priority from the Priority list.
-
Next, if you wish to filter the alarms based on the time at which the alarm was started, you can override the default settings provided in the settings windows (see Figure 8) that appears upon clicking the
 icon. This windows provides you to define specific criteria for analyzing alarms based on time, duration, acknowledgments and display preferences.
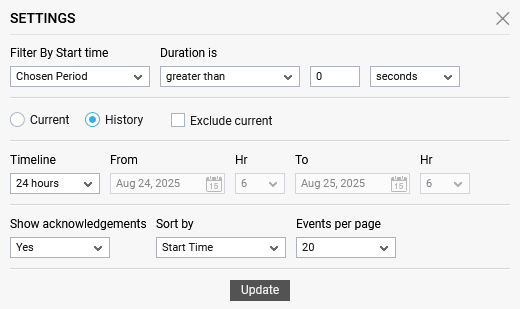
Figure 8 : The Settings window
The Filter By Start Time list in this window allows you to filter the alarms based on time. By default, the Chosen Period option is chosen from this list indicating the alarms that occurred within the configured time range will be listed. However, to view all alarms regardless of time period, select the Any Period from this list. To view alarms that remained unresolved for longer than a specific duration, choose greater than from the Duration is list, enter the desired value, and select the time unit from the list box alongside. For example, to view the history of the alarms unresolved for over 1 hour, select the greater than option, enter 1 in the text box alongside, and select hours from the list box adjacent to it in Figure 8. This will display the alarms unresolved for over 1 hour in the Metrics page.
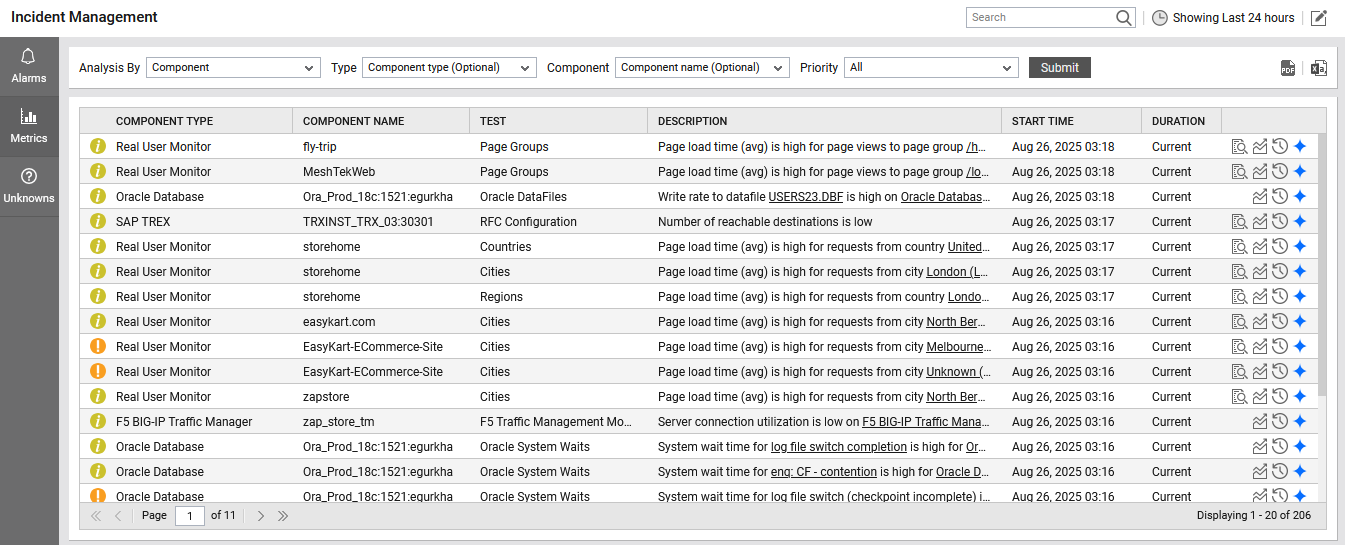
Figure 9 : Alarms that have remained open for a duration greater than 1 hour
Similarly, you can view the history of alarms unresolved for a time period lesser than a specified duration. To achieve this, select the lesser than option from the Duration is list, specify a value in the adjacent text box, and select a unit of time from the list box.
-
Next, you can filter alarms based on their status and time. Select Current to view only active or open alarms. Selecting History will display past alarms generated within the configured timeline. When you select the History option, the Exclude Current checkbox appears alongside and allows you to exclude any open or unresolved alarms that were generated during the configured time period, showing only alarms that have been fully resolved.
- For viewing the details of alarms that were generated during a specific time window, select a fixed Timeline, or choose Any to provide a date/time range. By default, 24 hours is chosen for the Timeline.
- By default, the Show acknowledgements flag is set to Yes indicating that the Metrics page displays the acknowledgment history of alarms by default. However, if you do not want to view the acknowledgment history of alarms in the Metrics page, set this flag to No.
- Next, select the column by which the alarm history is to be sorted from the Sort by list. By default, this is set to Start Time. However, if you wish to sort the alarm based on the components, then select the Component Name option from this list.
- In addition, you can configure the number of event records to be displayed per page of the event history. By default, 20 records are displayed per page. To display more records, select an appropriate value from the Events per page list.
- Finally, click the Update button in the settings window to save the settings.
- The details pertaining to every alarm such as the component type, name of the component, alarm description, name of the layer and start time of the alarms are displayed. Every row of alarm information will be accompanied by a colored indicator, that indicates the corresponding alarm priority. Critical alarms will be of the color red, major alarms will be in orange, and the minor ones come in yellow. The rows are also provided with icons for accessing the detailed diagnosis (if available) and viewing measure graphs.
-
Sometimes, a single alarm raised by the eG manager could have undergone many transitions/changes during the specified Timeline. An alarm can change under any of the following circumstances:
- A change in the alarm priority: This could be a switch to a higher or lower priority.
- A change in the alarm description: For example, originally, a usage-related alarm may have been raised on disk 'D' of a server. Later, disk 'C' of the same server might have experienced a space crunch, causing another alarm to be raised.
- A change in the list of impacted services
-
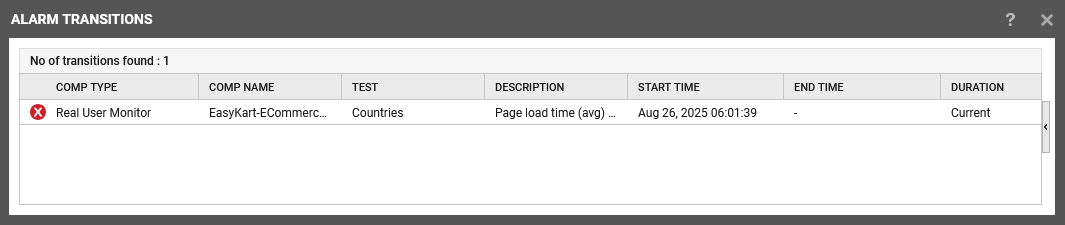
Clicking an alarm will open the alarm transitions window that displays the history of transitions experienced by that particular alarm. If the alarm has not undergone any transitions, then the Alarm Transitions window that appears will once again display the details of the alarm that was clicked on. On the other hand, if the alarm had experienced one/more transitions during the given Timeline, then the Alarm transitions window will provide the details of each transition - such details include, the alarm priority at the time of the transition, the component name, test, and alarm description during the transition, when the transition began (start time), when it ended (end time), and the total duration of the transition (see Figure 10).
-
Using the details provided in the Alarm transitions window, you can understand how many transitions have occurred for an alarm in a specified time window, and what they are. To focus only on the state (critical/major/minor) changes that an alarm experienced, click on the left-arrow button to the right of the Alarm transitions window. Alternatively, you can click on any of the alarm transitions in this window. This will invoke a distribution pie chart that reveals the percentage of time during the total transition period the alarm has been in the critical, major, and minor states. This reveals how alarm priorities have changed during the entire transition period (see Figure 11).
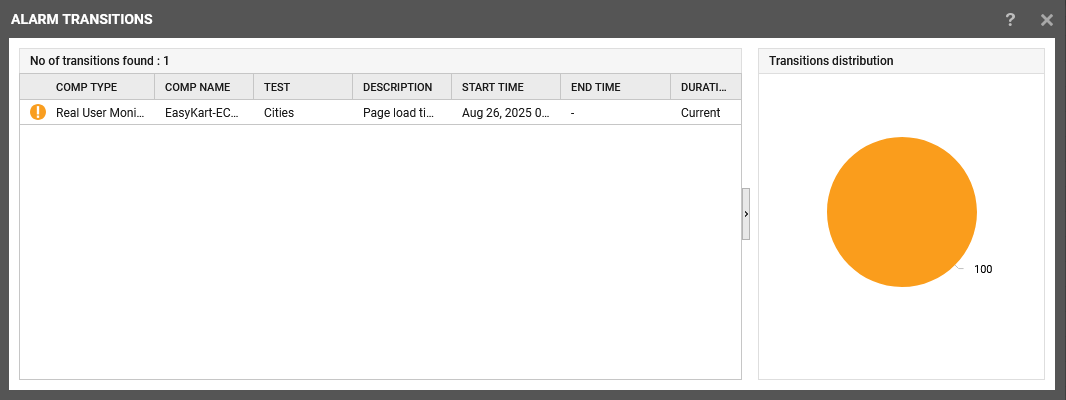
Figure 11 : Distribution of problems encountered during the transition period
-
The Metrics page also comprises of a GRAPH icon, which when clicked, allows you to view the graph of the corresponding measure for the last one hour. If the detailed diagnosis capability has been enabled for the eG installation, then problem measures for which detailed diagnosis is available will be accompanied by the DIAGNOSIS icon. When this icon is clicked, the detailed diagnosis of the measure will appear, throwing greater light on the problem condition. By default, the graph and detailed diagnosis information will be displayed in the same window as the event history.
- You can save this page in the CSV format by clicking on the CSV icon in this page. To save it as a PDF document, use the PDF icon.
- The navigation buttons, and the hyperlinked page numbers are provided to enable you to easily browse the alarm information that runs across pages.
Unknowns
The Unknowns tab page displays the tests that are currently in an unknown state in the environment. A test can switch to an unknown state when the eG Enterprise system is unable to determine the state of one/more metrics that test reports - this could be because of any of the following reasons:
-
The test might have been configured incorrectly.
-
The eG agent running the test may have stopped unexpectedly.
-
The eG agent could be unable to retrieve metrics from the server.
-
The eG agent might collect metrics but fail to send them to the eG manager due to issues like poor network connectivity.
By default, Unknowns option is chosen from the Show list indicating that the Unknowns tab page lists the tests in an indeterminate (i.e., unknown) state, the layers to which the tests are mapped, the names of the components they are associated with, and their corresponding component types.
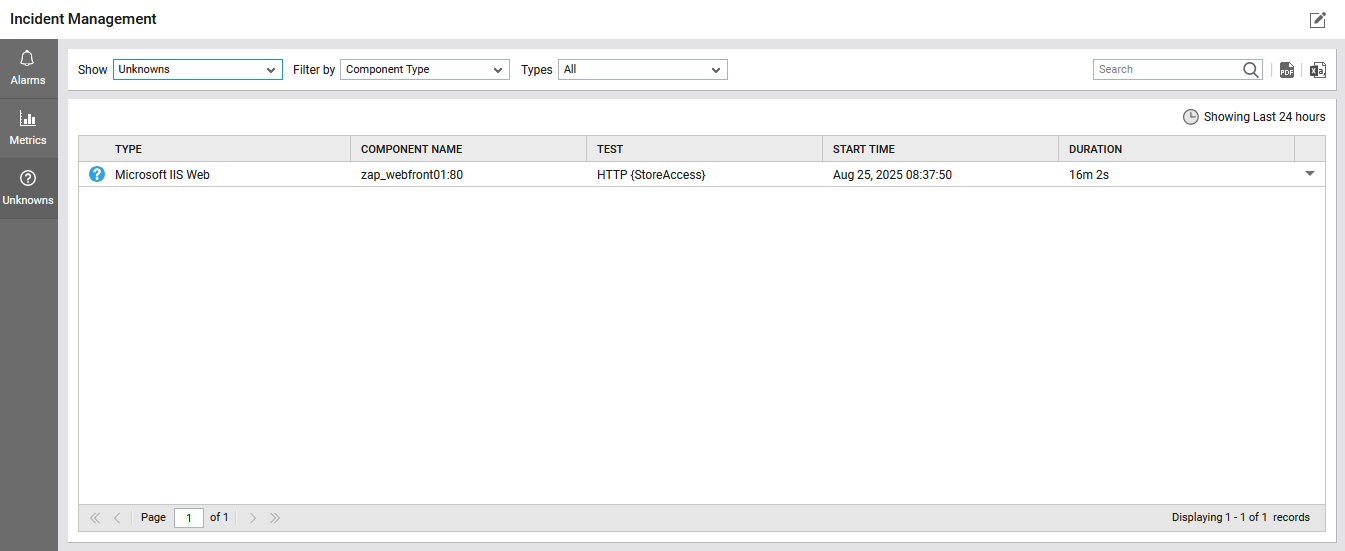
Figure 12 : The components, tests, and metrics in an Unknown state
By using a dropdown icon provided in every row (see Figure 12), you can determine which measure(s) of the test is in the unknown state currently and which services are impacted by this (see Figure 13).
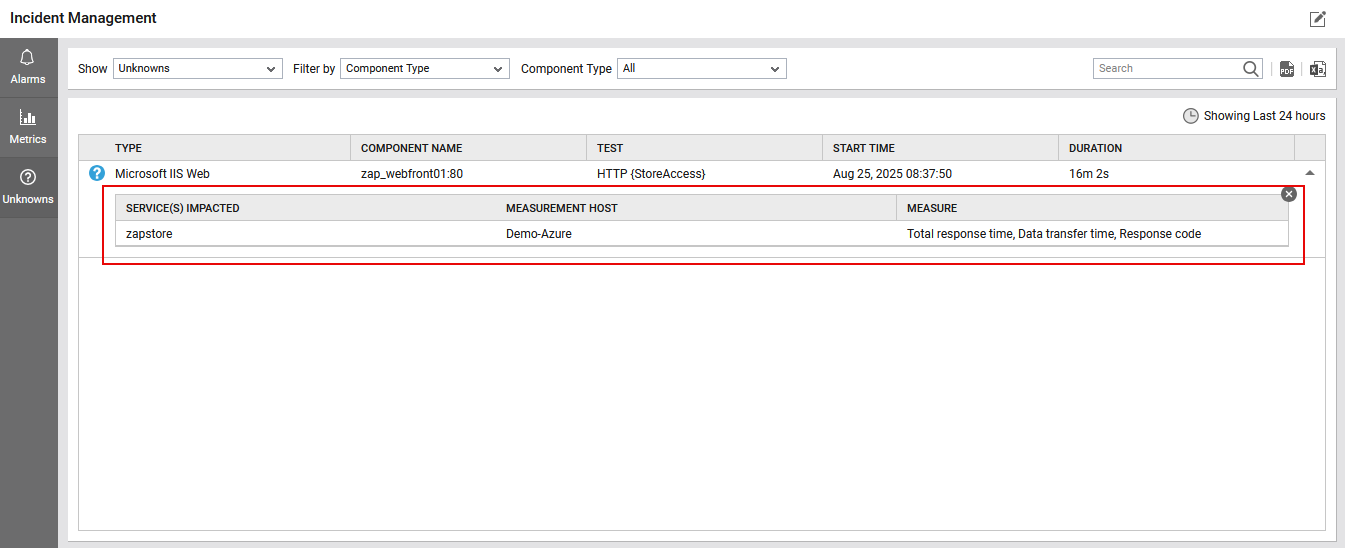
Figure 13 : Viewing additional information related to the Unknown alerts
By default, the eG Enterprise system displays the unknown tests across all managed component types in the environment in Figure 12 and Figure 13. This is why, the Filter by list is set to Component Type by default and the Component Type list is set to All by default in Figure 14. To view the Unknowns related to a specific component type, pick any type of your choice from the Component Type list. Doing so will list only those unknown tests that are associated with the components of the chosen Type (see Figure 14).
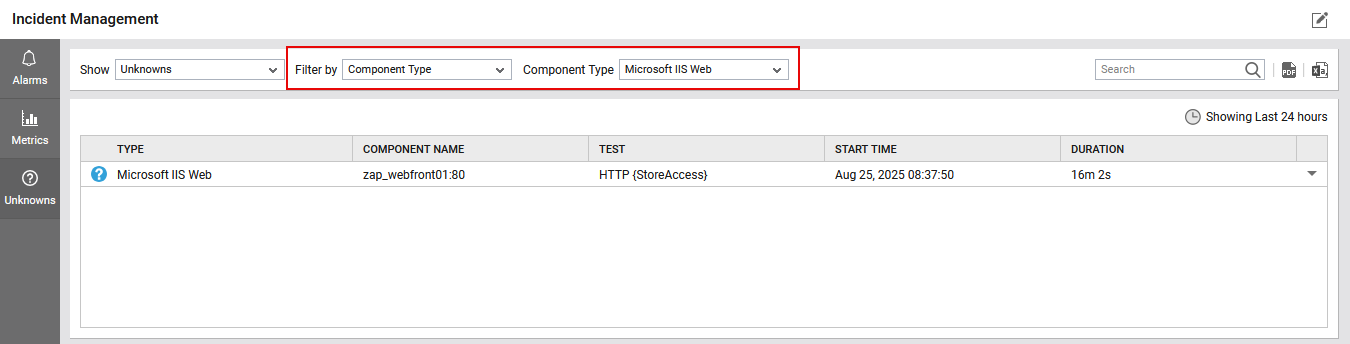
Figure 14 : Viewing the details of Unknowns related to a specific component type
You can even filter the Unknowns list on the basis of service and segment names, so that you can quickly figure out which service/segment components have been affected by Unknowns and what tests and metrics are causing this. For instance, to view the Unknown tests in a service, select Services from the Filter by list and pick a service from the Services list. The service components with Unknowns, their corresponding component types, the layers to which the unknown tests are mapped, and the unknown tests themselves will then be listed, as depicted by Figure 14.
Likewise, to view the details of Unknowns in a particular segment, pick Segments from the Filter by list, and select the Segment of interest to you. The list that appears will display the segment components with Unknowns, their corresponding component types, the layers to which the unknown tests are mapped, and the unknown tests themselves.
Where there are numerous components with Unknowns, you can quickly zoom into the Unknowns of specific interest to you using the search utility that the Unknowns tab page embeds. For instance, to view the Unknowns related to particular component type, pick the Type criterion from the Search by list and specify the whole or part of the component type to search for in the text box next to it. Then, click on the 'magnifying glass' icon within. This way, you can instantly access information related to the Unknowns in all component types with names that match the specified search string (see ).
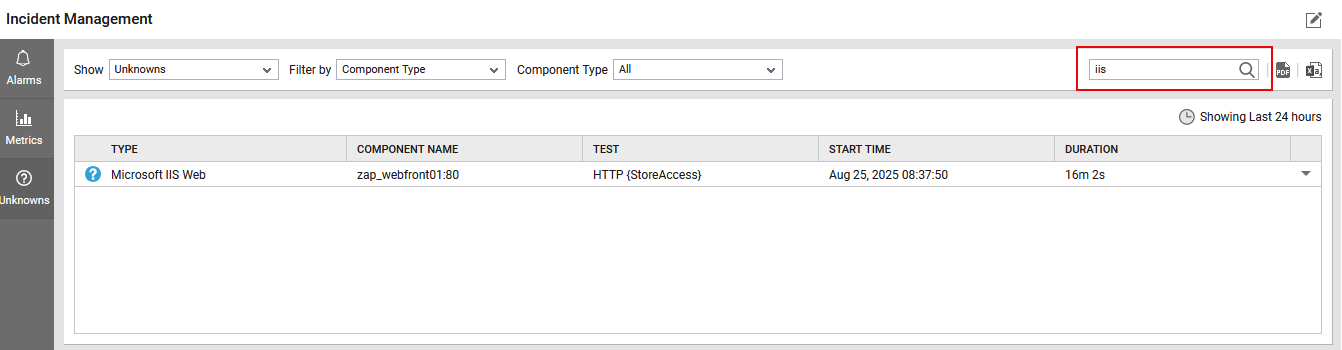
Figure 15 : Searching for the details of Unknowns in a particular component
Besides component Type, you can build search conditions on the basis of Component name, Test name, and Layer name by selecting the desired search criterion from the Search by list and specifying the corresponding search string in the adjacent text box.