Virtual Apps Dashboard
The Virtual Apps Dashboard provides an at-a-glance look at the overall health of the Virtual Apps server, user's logon performance and resources utilization at different levels.
To access the dashboard, follow the menu sequence: Monitor -> Dashboards -> Digital Workspaces -> Virtual Apps.
By default, the Virtual Apps Dashboard will be displayed only if components of the following component types are managed in the target environment.
-
Citrix Virtual Apps 7.x
-
-
Microsoft RDS
Accordingly, the Type list box will list all these component types and by default, the Citrix Virtual Apps 7.x will be chosen from this list indicating that the dashboard is plotted for the Citrix Virtual App Servers in the target environment.
By default, the DefaultDashboard view is chosen from the Views list. This indicates that the dashboard is created by default for the components of the chosen Component Type.
The sections that follow will discuss each page of the Virtual Apps dashboard in detail.
Overview
The Overview page provides a bird's eye view of the overall health of the target Virtual Apps environment as well as the aggregate resource utilization of applications hosted in the environment (see Figure 1).
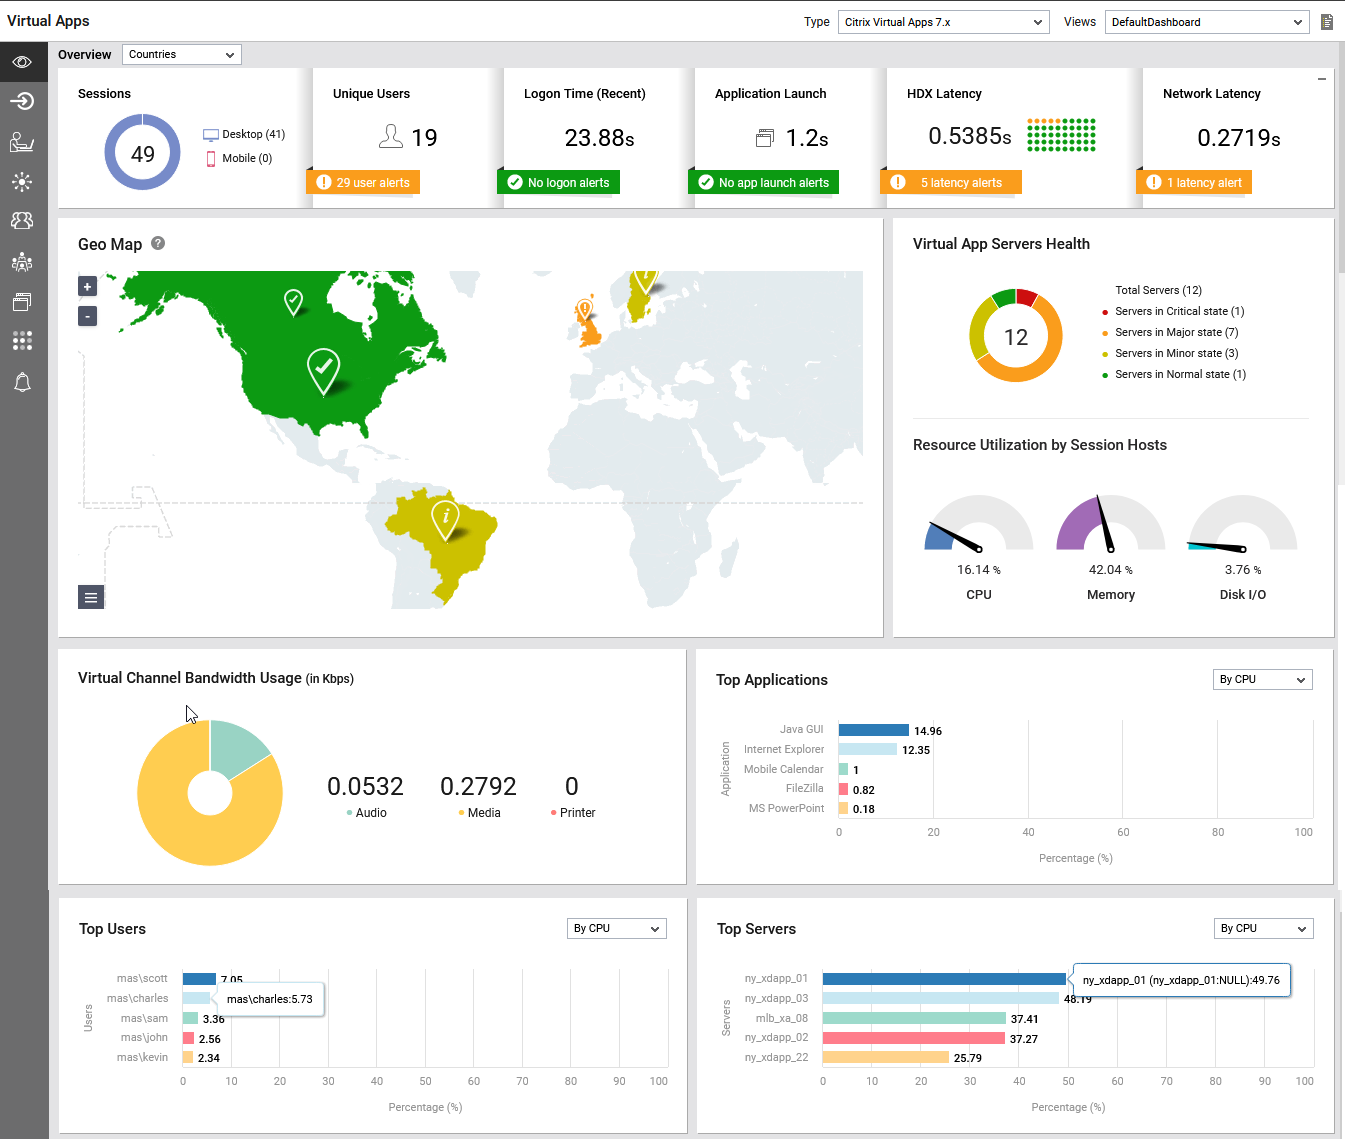
Figure 1 : The Overview page of the VIRTUAL APPS dashboard
With the help of a group of visual tools – e.g., intuitive icons, color-coded values, miniature graphs, geo maps, etc. - the Overview page of the Virtual Apps dashboard helps you find quick and accurate answers, from just a glance, to the following questions:
- From which devices are the sessions established from - desktops? mobile phones? Or tablets? Which is the most popular device?
- Are the Virtual Apps servers in the environment healthy? If not, then how many servers are affected by major or critical issues?
- Are the Virtual Apps servers utilizing the resources optimally?
- How many distinct users are currently accessing the Virtual Apps servers? - this is a good indicator of the number of users who are truly utilizing the to the traffic on the web site.
- Is logging into the Virtual Apps server failing frequently/taking too much time?
- Is any application taking longer time to launch?
- Are users facing latencies to connect to the Virtual Apps server?
- Are users from any particular Geo location over-utilizing the CPU/memory resources?
- What type of data (audio/media/printer) is consuming maximum amount of virtual channel bandwidth?
- Which application/user/server is consuming maximum CPU/memory resources?
Let us now discuss each section available in this page with respect to Citrix Virtual Apps 7.x component type in detail.
The Sessions doughnut chart helps administrators identify the device types from which the sessions were established from - is it desktops? or mobile phones? or tablets? By merely looking at this doughnut chart, administrators can identify the device type that is widely used to establish the sessions. Clicking on a device type from this section ( see Figure 1) will lead you to the User Experience Overview dashboard that displays the information of all the users who have established the sessions using the chosen device type (see Figure 2).
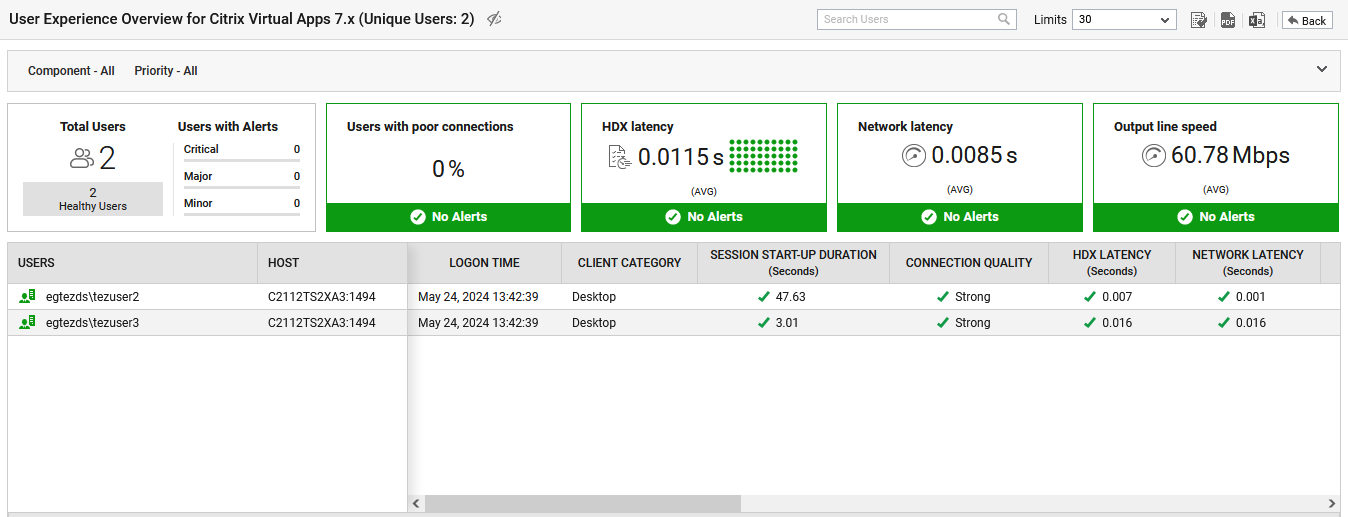
Figure 2 : The User Experience Overview page displaying the users who established sessions through the chosen device type
The Unique Users section displays the number of unique users accessing the target virtual server. Clicking on the number in this section also leads you to the User Experience Overview dashboard that displays information about all the users who had established sessions in the target environment.
Also, this section reveals the count of alerts raised for the users who have established sessions on the target virtual server. Clicking on the count of alerts will lead you to Figure 3 that displays all the individual alerts raised for the users in the target environment.
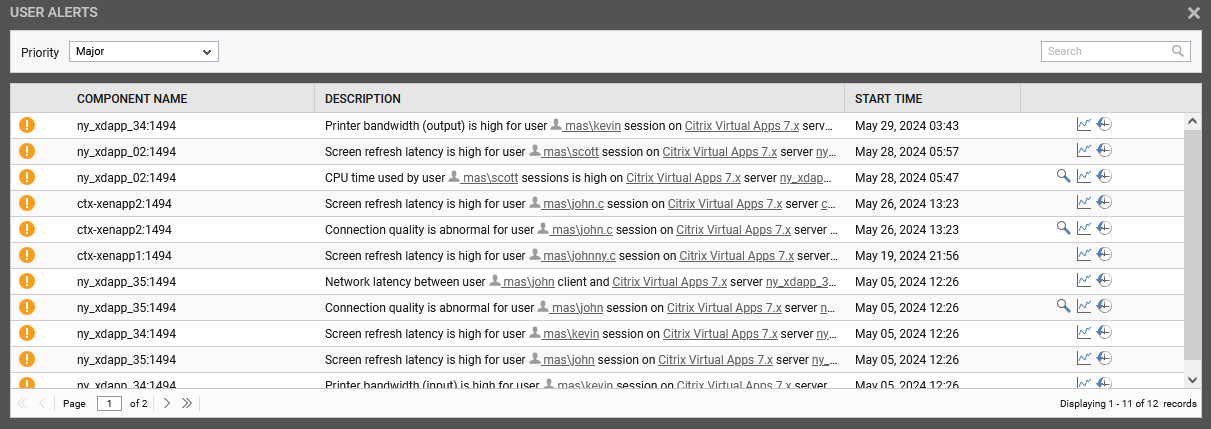
Figure 3 : The USER ALERTS window displaying the alerts raised for the users
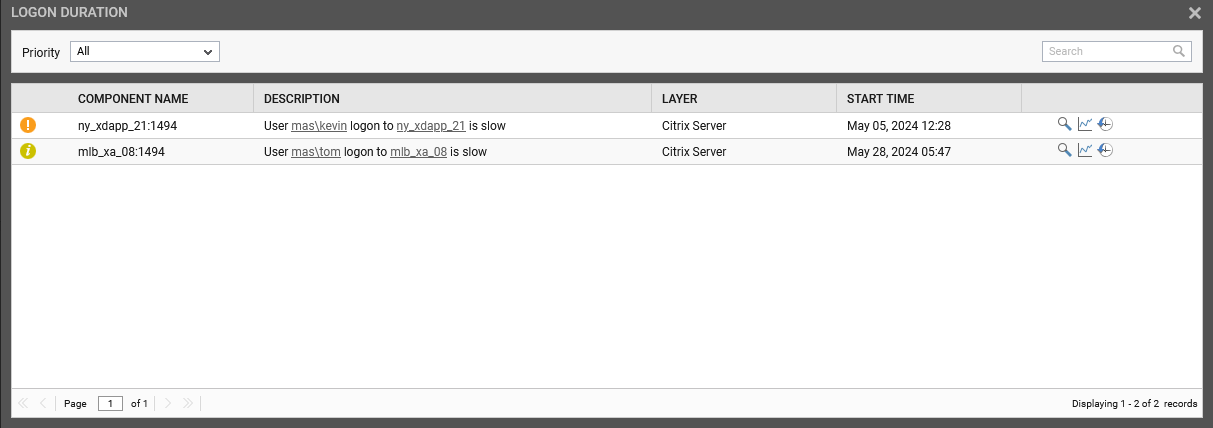
The Logon Time (Recent) section reveals the time duration taken by the user to establish the session. Also, this section captures and displays the count of alerts raised for the logon time of the users that exceeded a configured time duration. Clicking on the count of alerts will lead you to the logon alerts window that displays all the individual alerts raised for the delay in the logon time of the users logged into the target environment.
The Application Launch section reveals the average time taken by the users to launch an application in the target environment. Also, this section reveals the count of alerts raised for the delays noticed in the applications launched by the users. Clicking on the count of alerts will lead you to the app launch alerts window that displays all the individual alerts raised for the delay experienced by the users while launching the applications in the target environment.
The HDX Latency section reveals a heat map chart displaying the average screen refresh latency of the users i.e., the time interval measured at the client between the first step of user action and the last step i.e., the graphical response displayed of all user's interactions with the target server. Clicking the value displayed in this section will lead you to the User Experience Overview dashboard that highlights the users whose average screen refresh latency was high. Also, this section captures and displays the count of alerts raised when the average screen refresh latency of the users violated the default threshold values. Clicking on the count of alerts will lead you to the latency alerts window that displays all the individual alerts raised in the target environment with respect to the average screen refresh latency of the users.
The Network Latency section reveals the average latency experienced by the users when transmitting/receiving data over the ICA channel. Clicking the value displayed in this section will lead you to the User Experience Overview dashboard that highlights the users who experienced high network latency. Also, this section captures and displays the count of alerts raised when the network latency of the users violated the default threshold values. Clicking on the count of alerts will lead you to the latency alerts that displays all the individual alerts raised in the target environment with respect to the average network latency of the users.
To analyze user experience geographically, use the Geo Map section of the dashboard. The Geo Map in Figure 4 quickly tells you where your users are from. Location markers accurately pinpoint the countries from which the users have established sessions on the target server. The size of the location marker varies according to the number of sessions established by the users of each country - i.e., larger the marker, higher will be the number of sessions from that country. Also, to indicate the experience of users from a country, both that country and its corresponding marker are colored using conventional color-codes. This way, the map intelligently differentiates between the “happy” countries and the “unhappy” ones.
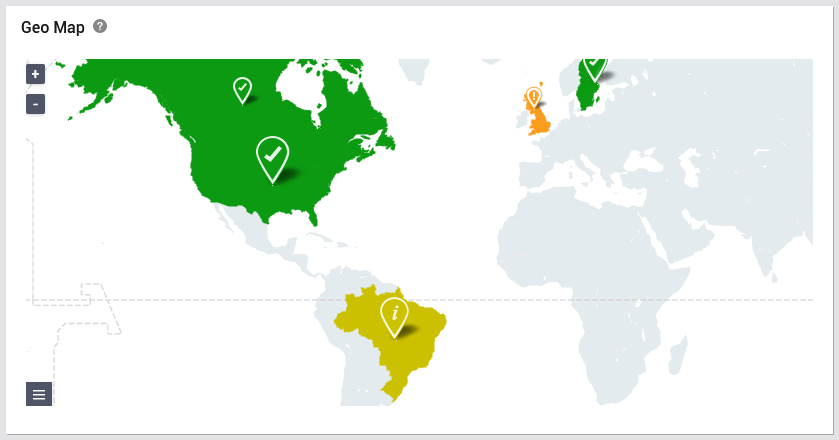
Figure 4 : The Geo Map section
Note:
At any given point in time, you can choose to view only the request indicators - i.e., the markers - or the response time indicators - i.e., the countries colored using conventional color-codes - in the map. For instance, to hide the markers, click on the button below the map, and uncheck the Requests check box. To hide the colored countries, uncheck the Response time check box (see Figure 5).
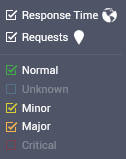
Figure 5 : Customizing the Geo map
You can also choose to view in the map, only those countries with a poor user experience. For this, you may want to uncheck the Normal check box in Figure 5, and check the Major, Minor, Critical, and/or Unknown check boxes therein.
To know why users from certain countries are 'unhappy' with the target Virtual Apps server, click on the problem country in the map. A box depicted by Figure 6 will appear revealing what the users from that country experience when interacting with the target Virtual Apps server. The sessions from the country, the average HDX latency, and percentage of CPU and memory utilization are displayed in the box. From this, you can easily infer what is ailing the experience of users from that country – latency? or excessive resource utilization?
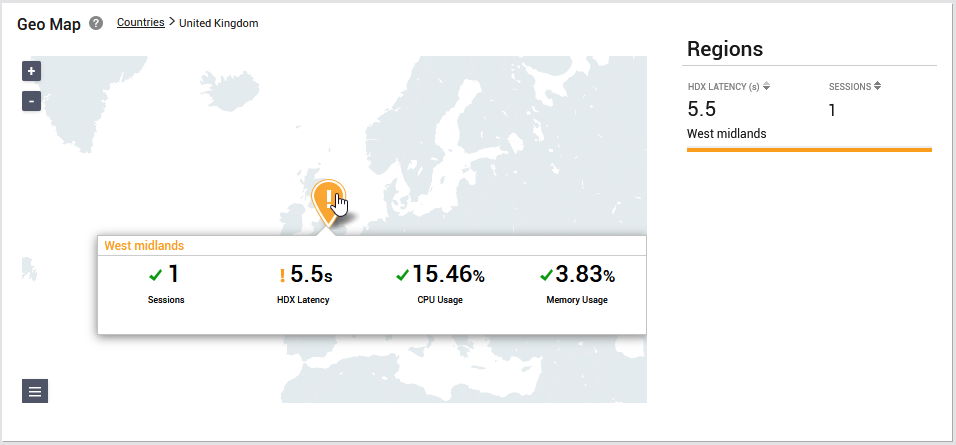
Figure 6 : Viewing the user experience statistics of a particular country in the Geo map
If users from a country are experiencing issues in sessions, it is only natural that you want to figure out whether the problem is widespread or is confined to a specific region within that country. This can be easily determined by zooming into a problem country in the map! For this, just select the country you want to focus on from the Countries drop-down list in the Geo section. Figure 6 will then appear revealing the exact regions (in that country) from which requests are received and the overall experience of the users from each region. Then, the Virtual Apps Servers Health section adjacent to the Geo Map section reveals the current health and resource utilization of the Virtual Apps servers in the environment.
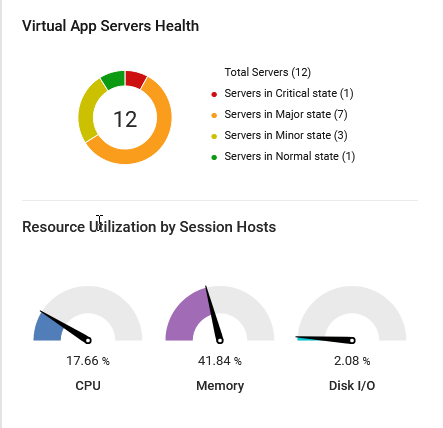
Figure 7 : The Virtual Apps Servers Health section
The Virtual Apps Servers Health section reveals color-coded doughnut graph that displays the count of Virtual Apps servers in critical / major /minor states with respect to current health. Clicking on a division in this graph will enable you to view the list of servers in a particular state. The windows that displays the list of servers also reveals the problems that the servers are currently facing. The Resource Utilization by Session Hosts sub-section in Figure 7 reveals the average percentage of CPU utilization, memory utilization and disk utilization of the Virtual Apps servers in the environment.
The Virtual Channel Bandwidth Usage section helps administrators to quickly check the bandwidth usage by the incoming and outgoing printer data/audio/multimedia traffic as shown in Figure 8. The color-coded doughnut graph provided in this section reveals the type of traffic that is causing excessive bandwidth usage, thereby providing pointers to how the client configuration can be fine-tuned in order to reduce bandwidth consumption and improve performance.
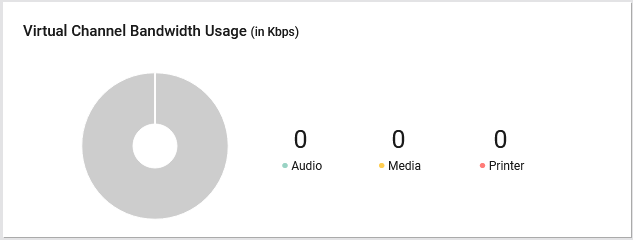
Figure 8 : The Virtual Channel Bandwidth Usage section
The Top Applications section helps administrators to identify the applications that are utilizing the maximum memory, CPU etc. Use the drop-down list provided at the right-corner of the section to select the criteria based on which you want to plot the bar graph. (see Figure 9).
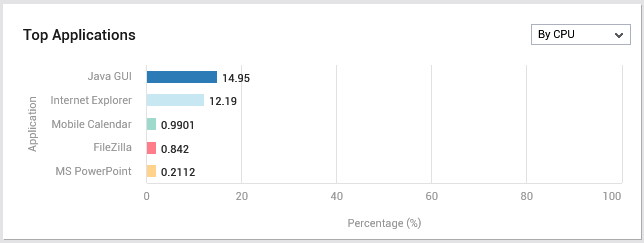
Figure 9 : The Top Applications section
The Top Users section point you the top users who are utilizing the maximum memory, CPU etc. Use the drop-down list provided at the right-corner of the section to select the criteria based on which you want to plot the bar graph. (see Figure 10).
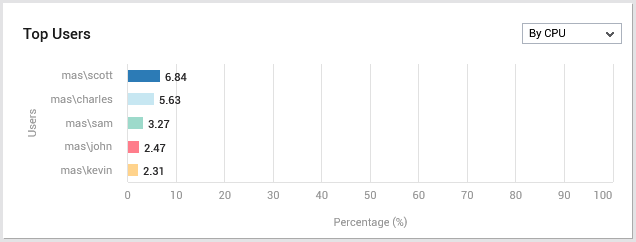
Figure 10 : The Top Users section
The Top Servers section point you the top servers that are over-utilizing the memory, CPU etc. Use the drop-down list provided at the right-corner of the section to select the criteria based on which you want to plot the bar graph. (see Figure 11).

Figure 11 : The Top Servers section
User Experience
The User Experience tab page appears when you click the User Experience option from the left panel of the Virtual Apps dashboard. This dashboard reveals the performance metrics related to the end-user experience in the Citrix Virtual Apps infrastructure during the last 10 minutes.
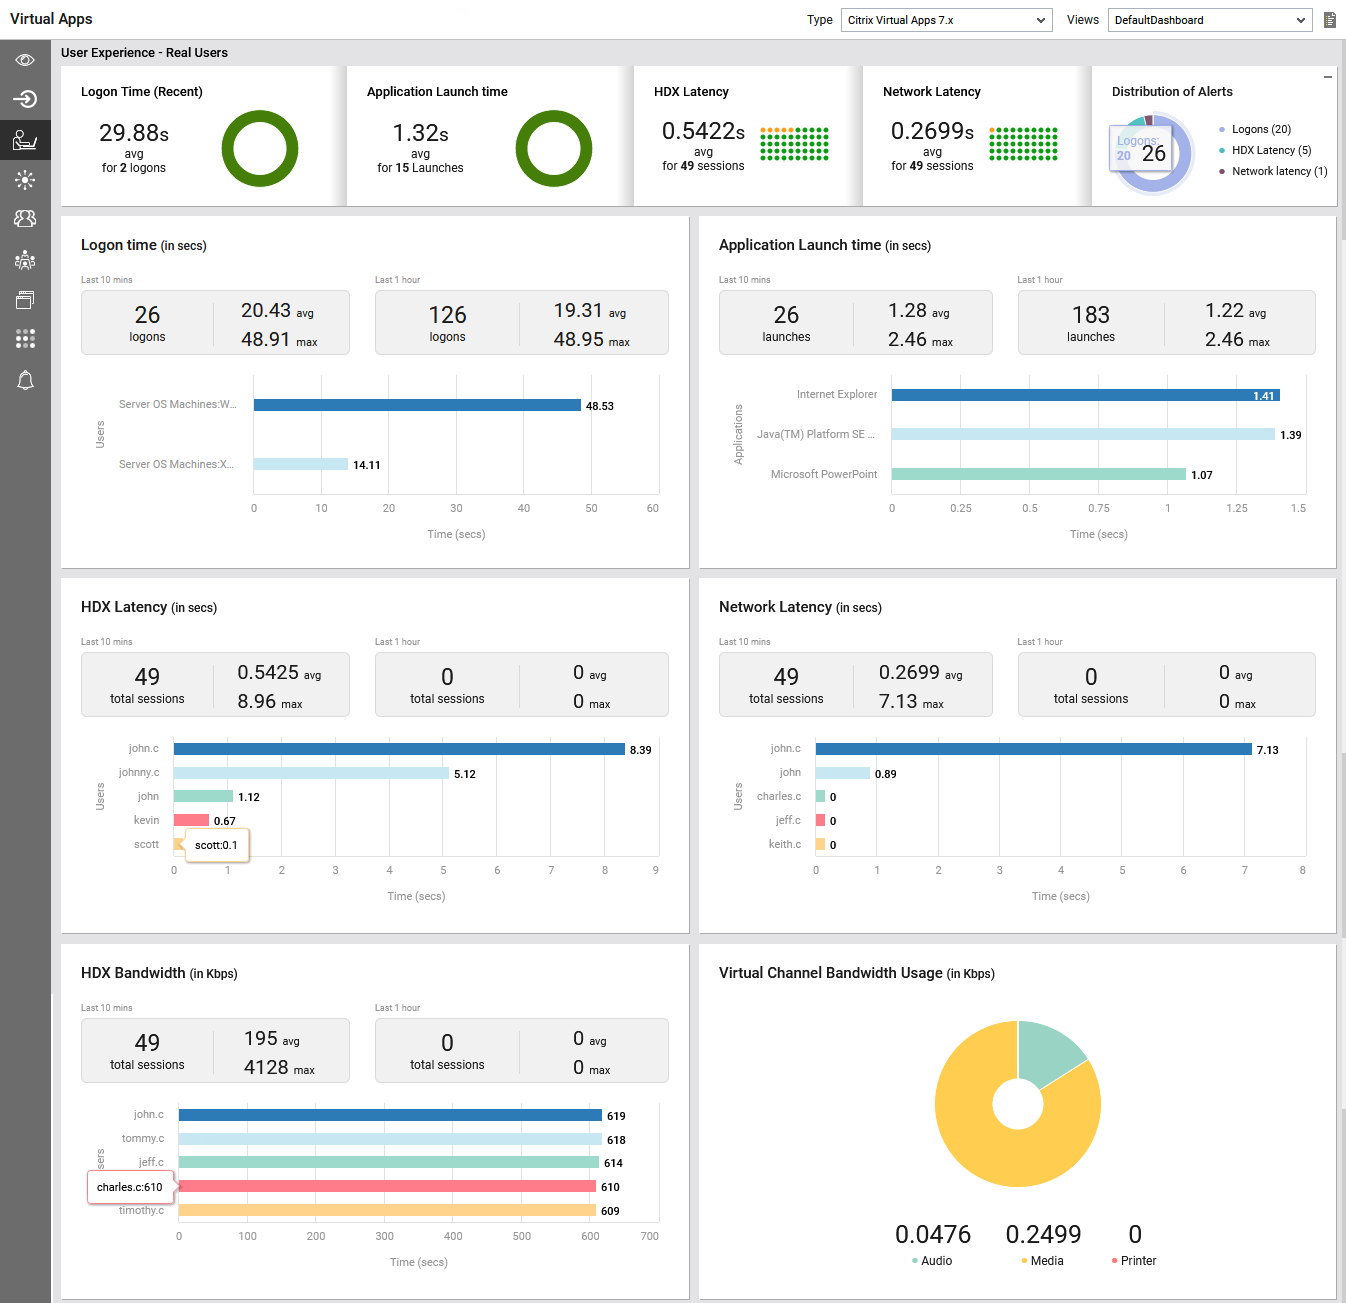
Figure 12 : The User Experience tab page
The top most ribbon in this dashboard helps administrators identify the following:
-
The Logon Time (Recent) section reveals the time duration taken by the users to establish the sessions during the last 10 minutes. Clicking on the doughnut chart provided in this section will lead you to the User Experience Overview dashboard that highlights the users whose logon duration was high.
-
The Application Launch time section reveals the average time taken by the users to launch an application in the target environment during the last 10 minutes. Clicking on the doughnut chart provided in this section will lead you to the Applications tab page of this dashboard.
-
The HDX Latency section reveals a heat map chart displaying the average screen refresh latency of the users i.e., the time interval measured at the client between the first step of user action and the last step i.e., the graphical response displayed of all user's interactions with the target server. Clicking the value displayed in this section will lead you to the User Experience Overview dashboard that highlights the users whose average screen refresh latency was high.
-
The Network Latency section reveals the average latency experienced by the users when transmitting/receiving data over the ICA channel. Clicking the value displayed in this section will lead you to the User Experience Overview dashboard that highlights the users who experienced high network latency.
-
The doughnut chart provided in the Distribution of Alerts section reveals the distribution of alerts raised for the delay in the logon time of the users and alerts generated when the average network latency and screen refresh latency of the users violated the default threshold values. Clicking on the legends provided in this section will invoke the pop-up windows that display all the individual alerts raised in the target environment with respect to the legend you are clicking on. For example, clicking on the Logons legend will invoke the OPEN PROBLEMS window that displays all the individual alerts raised for the delay in the logon time of the users logged into the target environment.
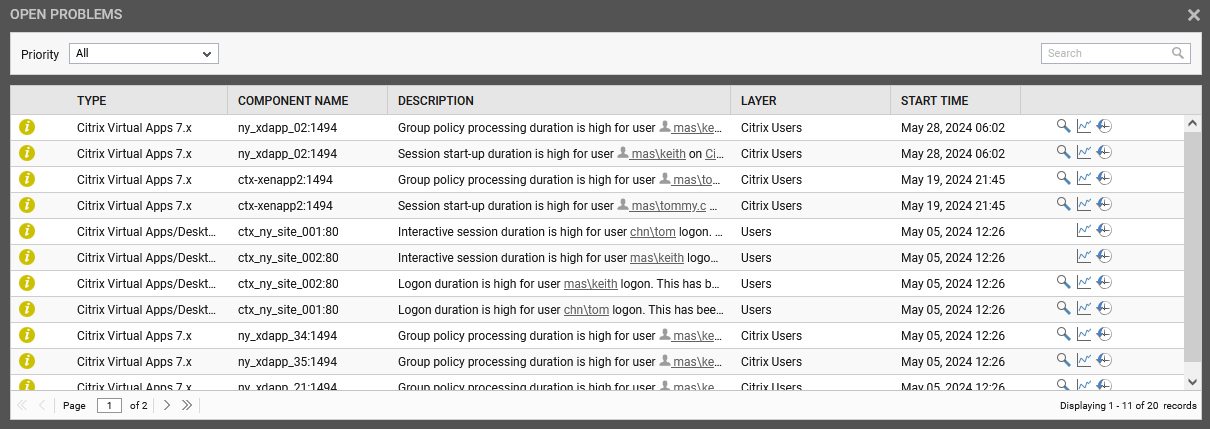
Figure 13 : The open problems in the Citrix Virtual Apps environment with respect to user logons
The Logon time section displays a bar graph that helps administrators identify average time taken by the users to login into the target server during the past one hour. Clicking on the graph will lead you to the layer model page of the target Citrix server where average user logon duration is recorded. The average logon time (in seconds) taken by a user during the last 10 mins is displayed under the Last 10 mins field and the average logon time taken by a user during the last 1 hour is displayed under the Last 1 hour field. Clicking on a value against the Last 10 mins and Last 1 hour fields will lead you to the layer model page of the target Citrix server where average user logon duration is recorded.
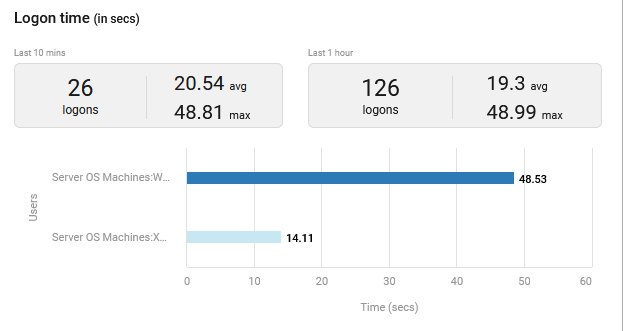
Figure 14 : The Logon time section in the User Experience page
The Application Launch time section reveals the average time taken by the users to launch an application in the target environment. The average application launch time (in seconds) taken by a user during the last 10 mins is displayed under the Last 10 mins field and the average application launch time taken by a user during the last 1 hour is displayed under the Last 1 hour field.
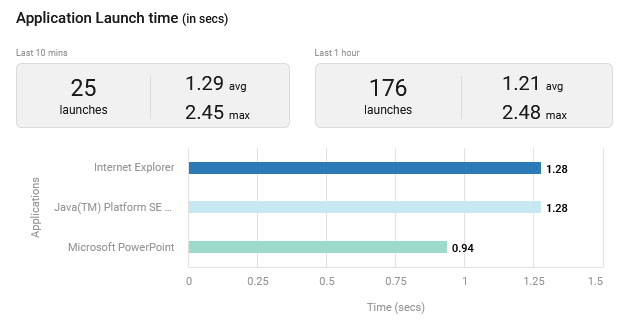
Figure 15 : The Application Launch time section in the User Experience page
In the HDX Latency section (see Figure 16), a bar graph displays the average screen refresh latency of the users i.e., the time interval measured at the client between the first step of user action and the last step. The average screen refresh latency (in seconds) of the users during the last 10 mins is displayed under the Last 10 mins field and the average screen refresh latency of the users during the last 1 hour is displayed under the Last 1 hour field.
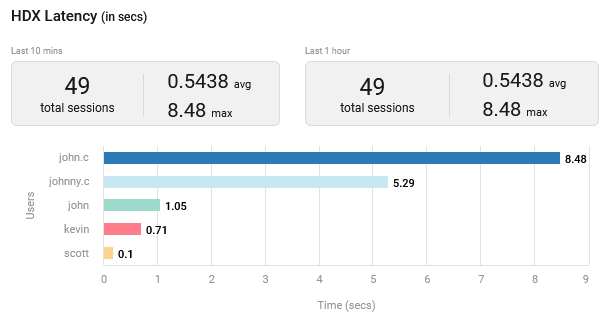
Figure 16 : The HDX Latency section of the User Experience page
Clicking a bar that represents a user will lead you to the User Experience dashboard of that particular user (see Figure 17).

Figure 17 : The USER EXPERIENCE DASHBOARD for a user
The Network Latency section reveals the average latency experienced by the users when transmitting/receiving data over the ICA channel. Clicking a bar that represents a user will lead you to the User Experience dashboard of that particular user (Figure 17). The average network latency (in seconds) of the users during the last 10 mins is displayed under the Last 10 mins field and the average network latency of the users during the last 1 hour is displayed under the Last 1 hour field.
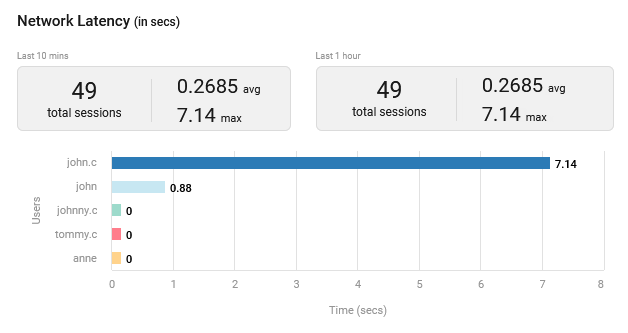
Figure 18 : The Network Latency of the User Experience page
The HDX Bandwidth section reveals the bandwidth used for flash data traffic from the users to the virtual desktop. By merely looking at the bar graph in this section, administrators can identify which user has been transmitting/receiving bandwidth-intensive flash data. Clicking a bar that represents a user will lead you to the User Experience dashboard of that particular user (Figure 17). The average HDX bandwidth (in Kbps) of the users during the last 10 mins is displayed under the Last 10 mins field and the average HDX bandwidth of the users during the last 1 hour is displayed under the Last 1 hour field.

Figure 19 : The HDX Bandwidth in the User Experience page
The Virtual Channel Bandwidth Usage section reveals the bandwidth consumption of the users when the virtual channel is used for transmitting/receiving the audio/media/printer data. By merely looking at the doughnut chart in this section, administrators can identify which type of data was maximum transmitted/received through the virtual channel. The average virtual channel bandwidth (in Kbps) of the users during the last 10 mins is displayed under the Last 10 mins field and the average virtual channel bandwidth of the users during the last 1 hour is displayed under the Last 1 hour field.
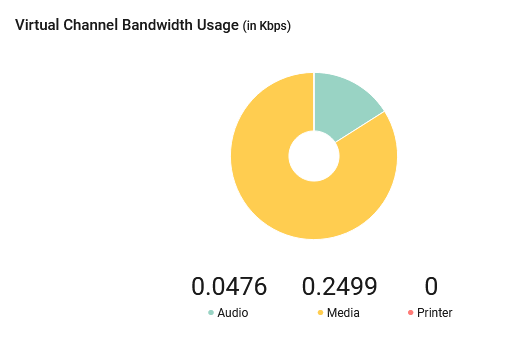
Figure 20 : The Virtual Channel Bandwidth Usage section in the User Experience page
Brokering
The Brokering page appears when you click on the Brokering option from the left panel of the Virtual Apps dashboard. This page reveals the non-availability and poor responsiveness of the license server in the site, session overload on the site and state of brokers, current status of each controller and key service and the count of machines registered with every controller, and connections/Server OS and Desktop OS machine failures in the site.
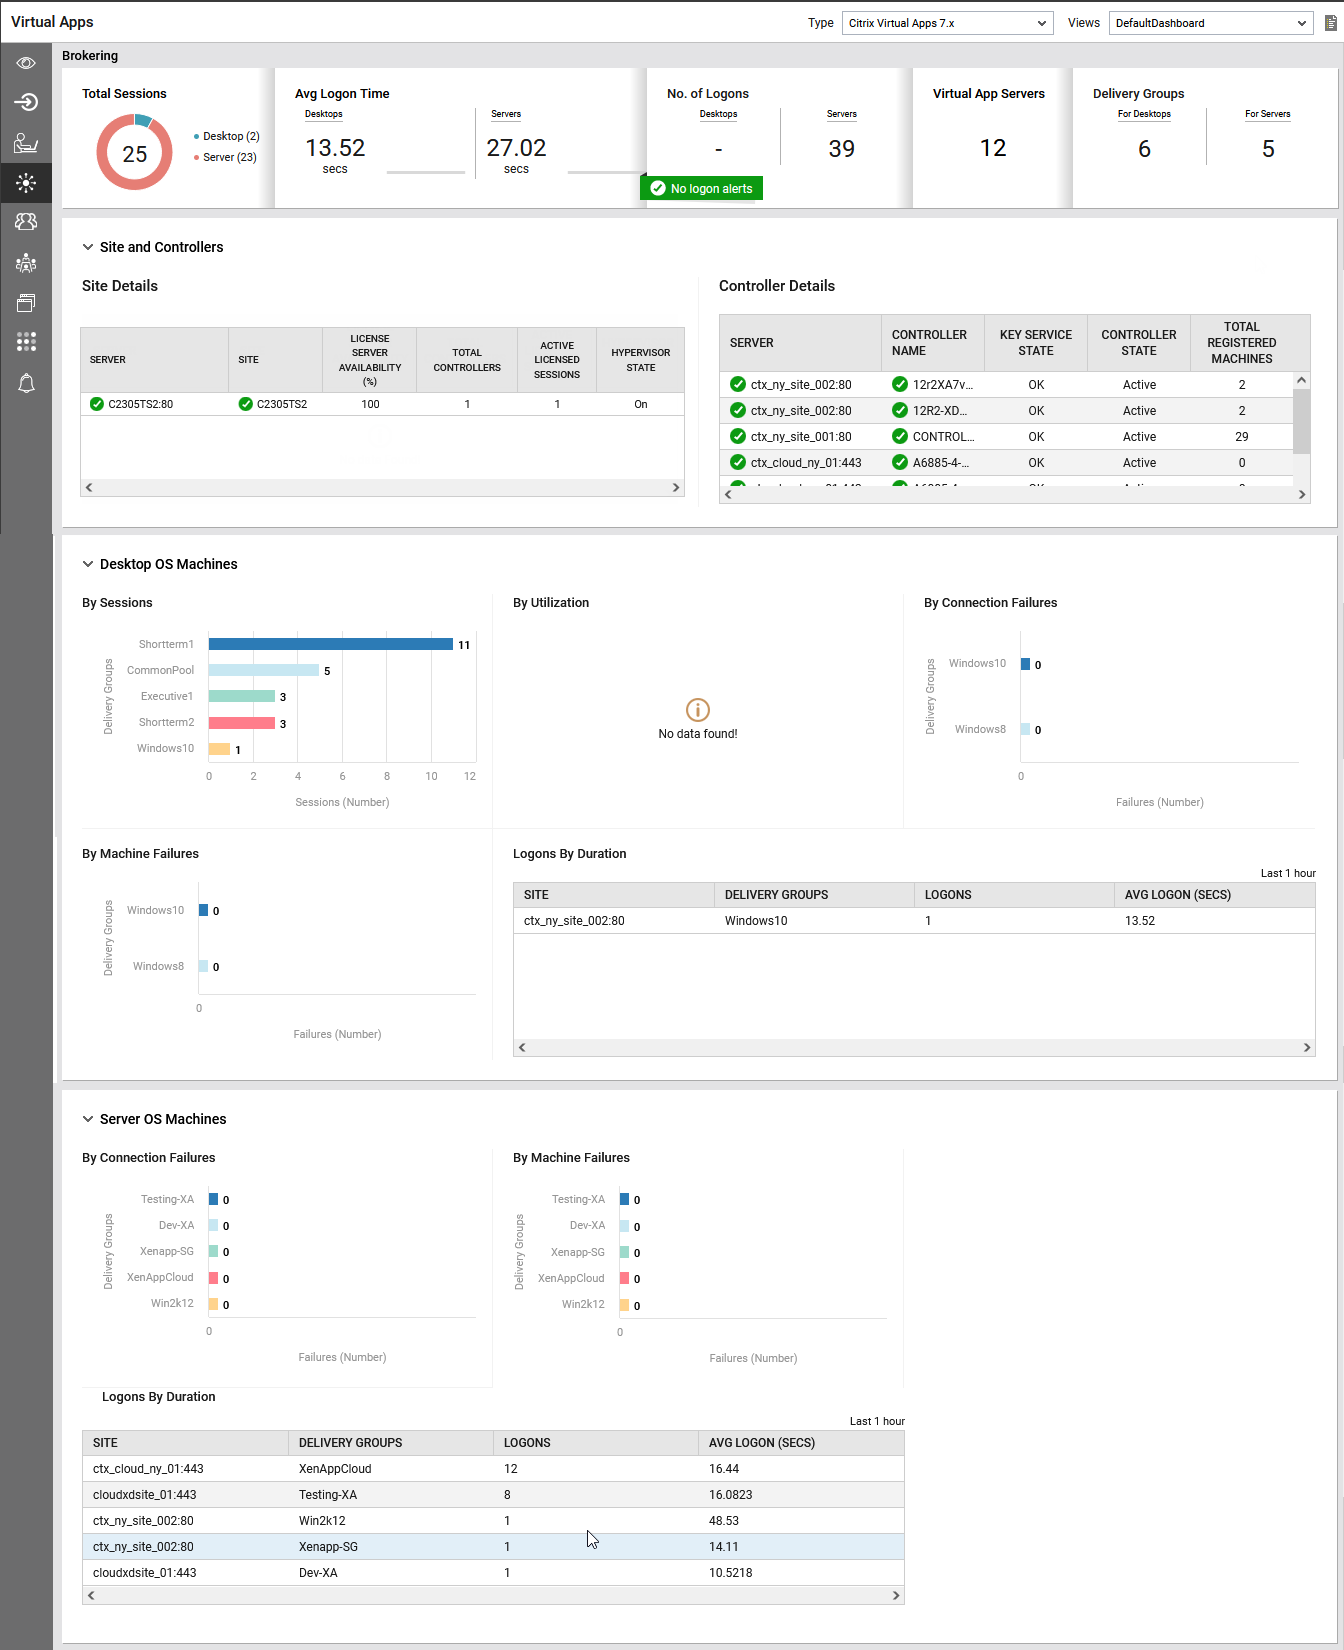
Figure 21 : The Brokering tab page of the Virtual Apps dashboard
The top most ribbon in this dashboard helps administrators identify the following:
-
The Total Sessions section reveals the total number of licensed sessions that are currently active on the site. The doughnut chart provided distribution of sessions established to the desktop OS and server OS machines in the site. The count of sessions displayed in this section is a good indicator of the load on the site.
-
The Avg Logon Time section displays the average time taken by users to login in to the desktop OS and server OS machines in the site. Clicking on the values will lead you to the layer model page of the target Citrix site where average user logon duration is recorded.
-
The No. of Logons section reveals the number of users who recently logged into desktop OS and server OS machines. Clicking on the values will lead you to the layer model page of the target Citrix site where user logons are recorded. If any alerts were captured for user logons, then, the count of alerts will be displayed in this section. Clicking on the alerts section will lead you to the layer model of the target server on which users experienced logon issues.
-
The Virtual Apps Servers section displays the count of Citrix Virtual Apps servers in the target Citrix site.
-
The Delivery Groups section displays the count of desktop OS and server OS machines delivered by the delivery groups. Clicking on the values will lead you to the layer model page of the target Citrix site where the count of machines is recorded.
-
The Desktop OS Machines section uses bar charts to show the number of sessions established, connection failures, and machine failures for each delivery group, along with overall utilization details. The Logons By Duration table lists each site and delivery group, the number of user logons to desktop OS machines, and the average logon duration, providing a clear view of usage and performance trends.
-
The Server OS Machines section uses bar charts to show the number of sessions established, connection failures, and machine failures for each delivery group. The Logons By Duration table lists each site and delivery group, the number of user logons to server OS machines, and the average logon duration, providing a clear view of usage and performance trends.
Delivery Groups
The Delivery Groups tab page appears when you click the Delivery Groups option from the left panel of the Virtual Apps dashboard. Note that this dashboard appears only if the Citrix Virtual Apps/Desktops Site 7.x component is managed in the target environment. This dashboard sheds light on the count of desktop OS machines and server OS machines that failed in each delivery group, connection failures, disconnected sessions, etc.
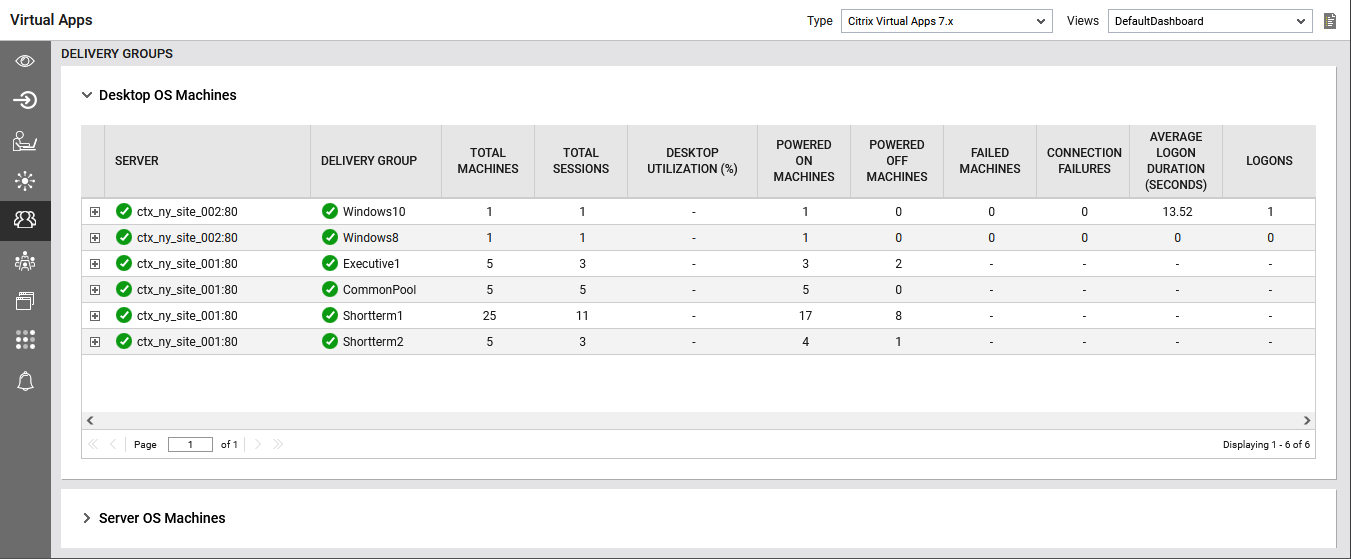
Figure 22 : The Virtual Apps - Delivery Groups dashboard
In Figure 22, the Desktop OS Machines section reveals the delivery groups that provision the desktop machines, and the count of machines provisioned to the site. By clicking on the plus icon provided along with the server name, you can find out the names of machines provisioned to each site. In addition, this section also displays the total number of machines and sessions established to those machines, the percentage of the machine utilization, the count of powered on/powered off machines, the count of machines that failed, the number of connection failures, the count of user logons to the machines and the time taken for logging in to the machines. Clicking on the delivery group will lead you to the layer model page of the target Citrix Virtual Apps/Desktops Site 7.x.
The Server OS Machines section (Figure 23) reveals the delivery groups that provision the server OS machines to the site and the count of machines provisioned to each site. By clicking on the plus icon provided along with the server name, you can find out the names of machines provisioned to each site. Additionally, you can also find out the resource utilization of the delivery groups, the count of machines that failed, the number of connection failures, the percentage of sessions established to the machines, the total number of machines and sessions established to those machines, he count of user logons to the machines and the time taken for logging in to the machines, the count of sessions that are currently active on the machines and the number of sessions that are disconnected. Clicking on the delivery group will lead you to the layer model page of the target Citrix Virtual Apps/Desktops Site 7.x.
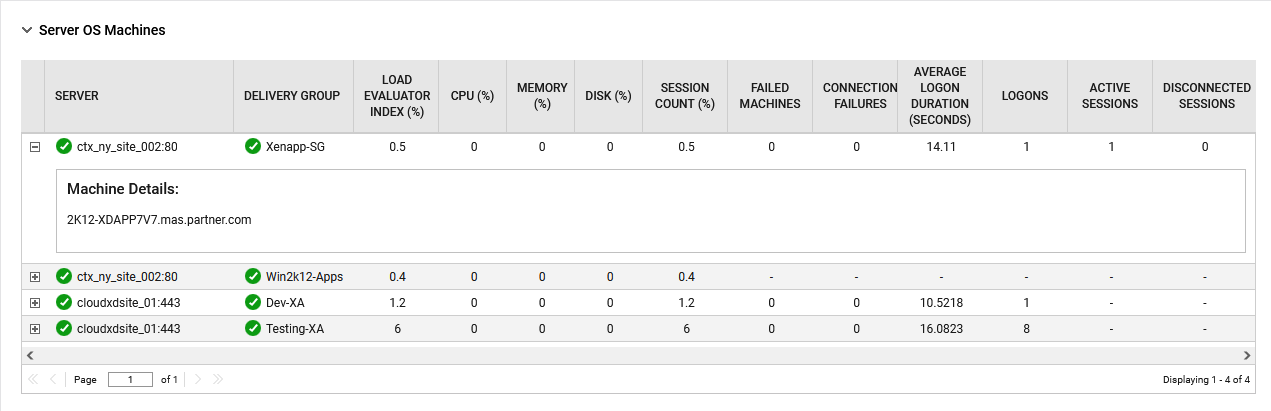
Figure 23 : The Delivery Groups - Server OS Machines section
Sessions
The Sessions tab page appears when you click the Sessions option from the left panel of the Virtual Apps dashboard. This dashboard sheds light on the session activity on the target Citrix server.
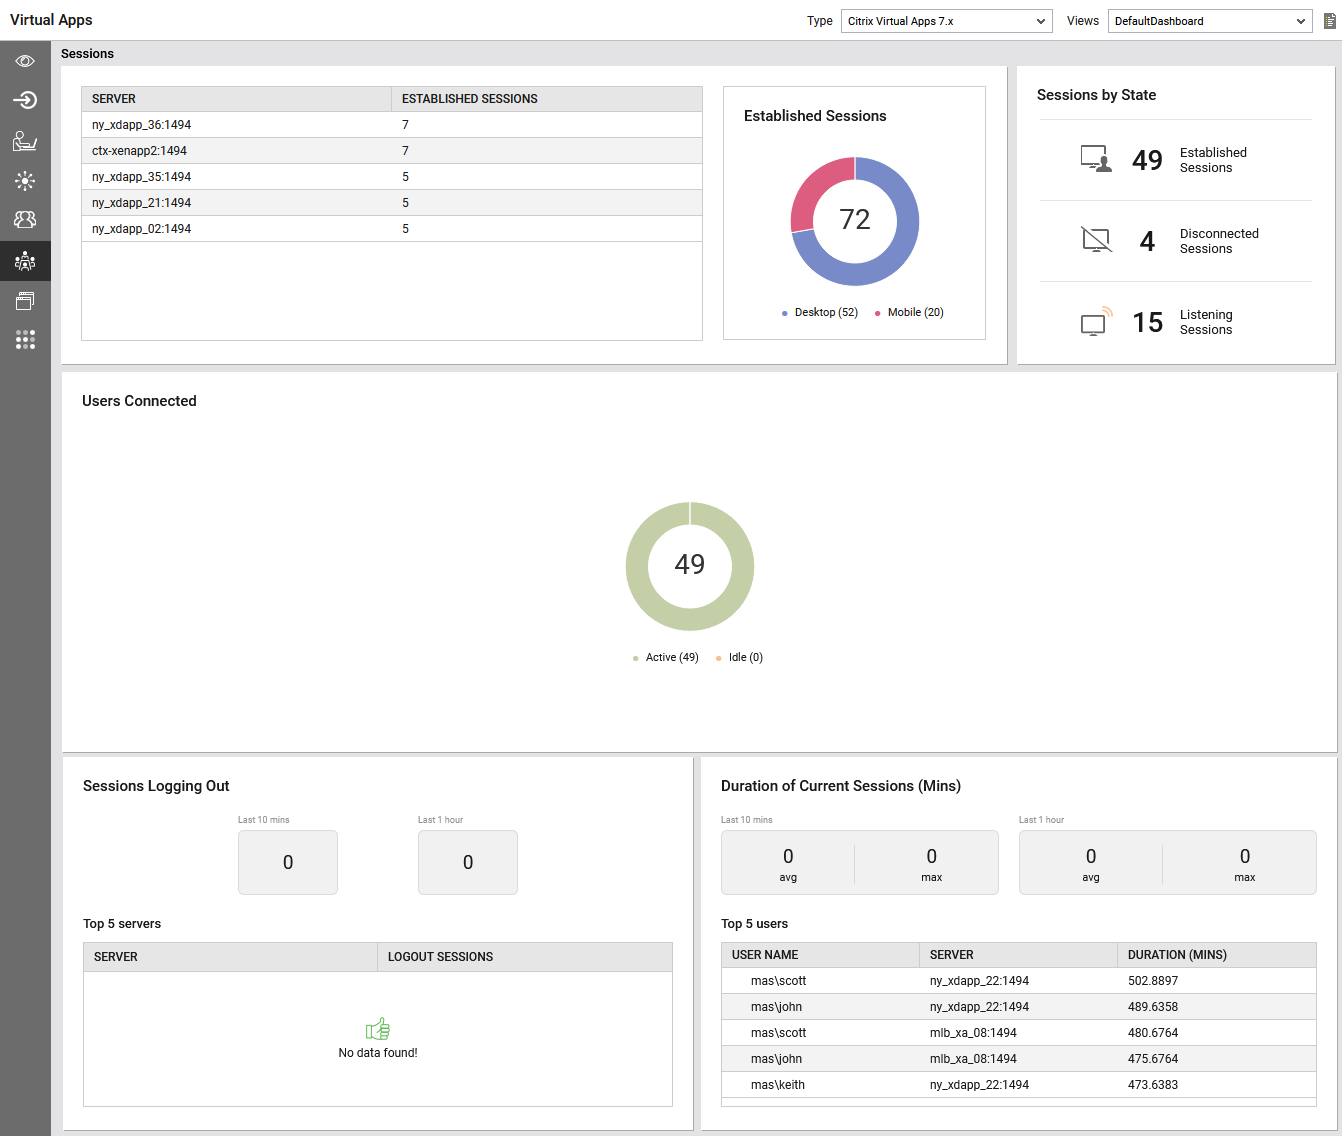
Figure 24 : The Virtual Apps - Sessions dashboard
The top most ribbon in this dashboard helps administrators identify the following:
-
A table provided in this ribbon displays the Citrix servers and the total number of sessions established to those servers. Clicking on the server name or the values will lead you to the layer model page of the target Citrix server where the count of sessions is recorded.
-
A doughnut chart in the Established Sessions section displays the distribution of sessions established from different types of devices. Clicking on the device type will lead you to the User Experience Overview dashboard.
-
The Session by State section reveals the count of sessions in different state such as the count of active sessions, the count of sessions that are disconnected and the count of sessions that are in listening state. By merely looking at this section, you can instantly know the workload on the target Citrix server.
The doughnut chart provided in the Users Connected section reveals distribution of the users who are currently in active and idle state.
The table provided in the Sessions Logging Out section displays the Citrix servers and the total number of sessions that were logged out from those servers. The number of the sessions logged by users during the last 10 mins is displayed under the Last 10 mins field and the number of sessions logged out by users during the last 1 hour is displayed under the Last 1 hour field.
The Duration of Current Sessions section reveals the top-N users based on in terms of the duration taken by them to login to the virtual machines., the Citrix servers to which the users established the sessions, and duration of the user sessions in minutes. The average and maximum session duration taken by the users during the last 10 mins is displayed under the Last 10 mins field and the average and maximum session duration taken by the users during the last 1 hour is displayed under the Last 1 hour field. Clicking on the user name will lead you to the User Experience dashboard of that particular user (see Figure 17).
Applications
The Applications tab page appears when you click the Applications option from the left panel of the Virtual Apps dashboard. This dashboard provides in-depth insights into overall application performance and to enable them to accurately isolate the root-cause of any application-level slowdown. Administrators can also proactively identify persistent problems by merely looking at this dashboard.
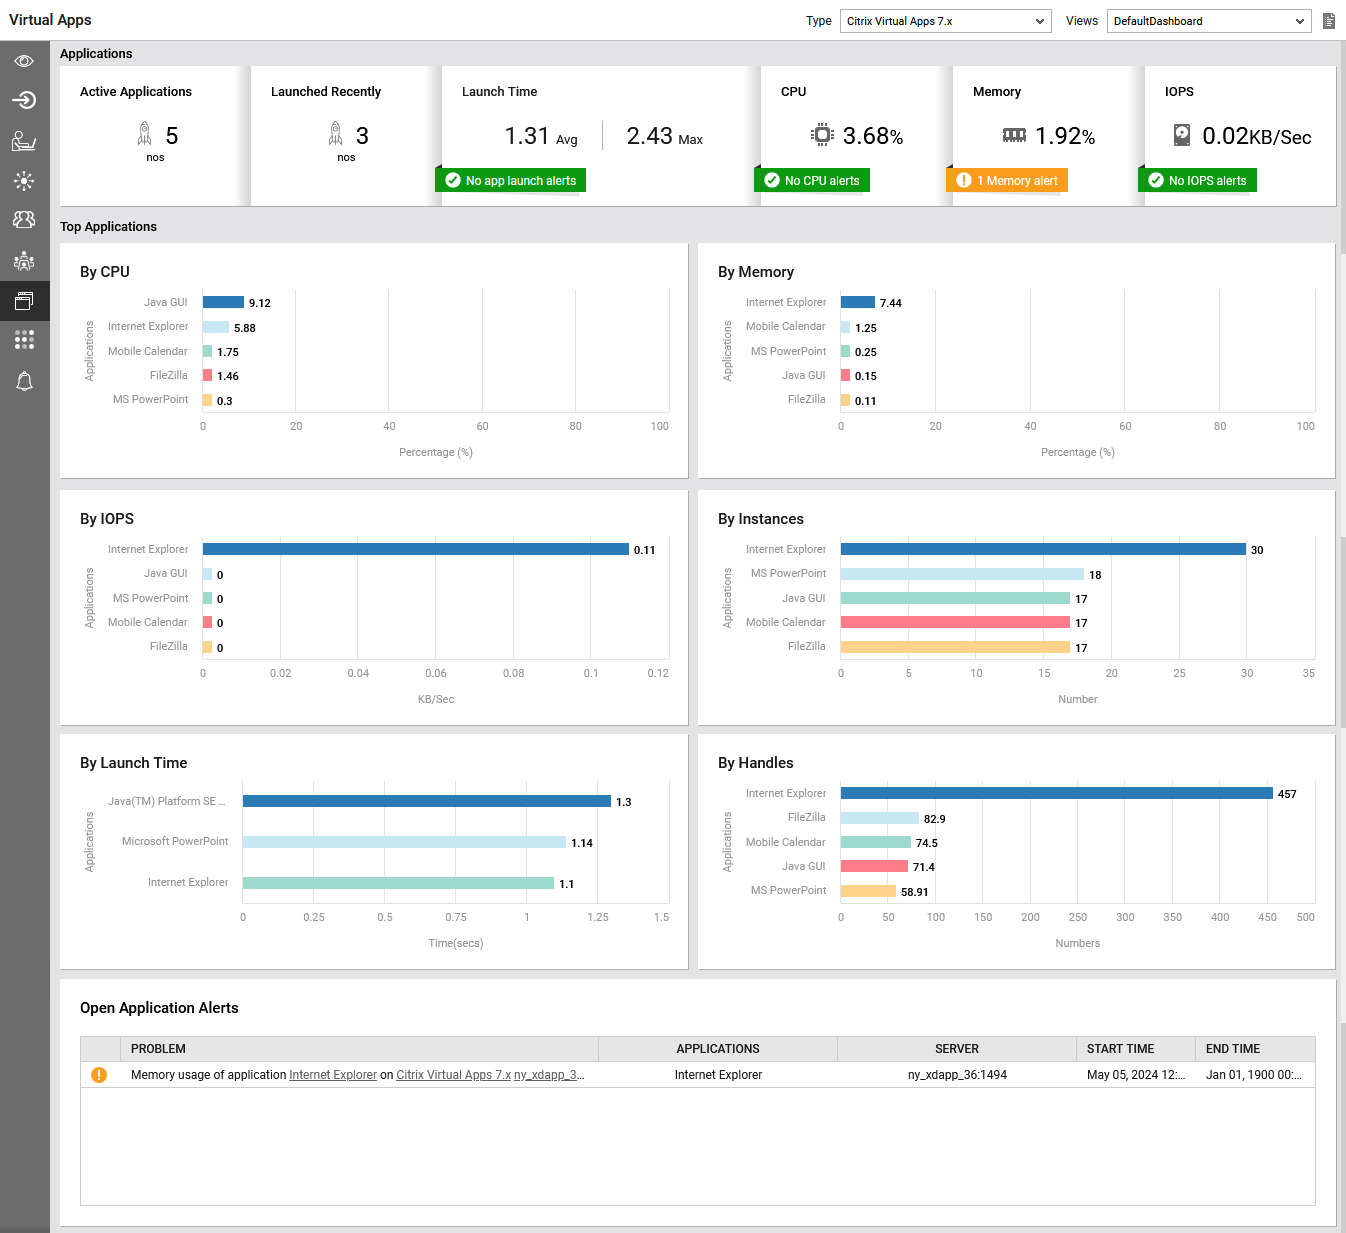
Figure 25 : The Virtual Apps - Applications dashboard
The top most ribbon in this dashboard helps administrators identify the following:
-
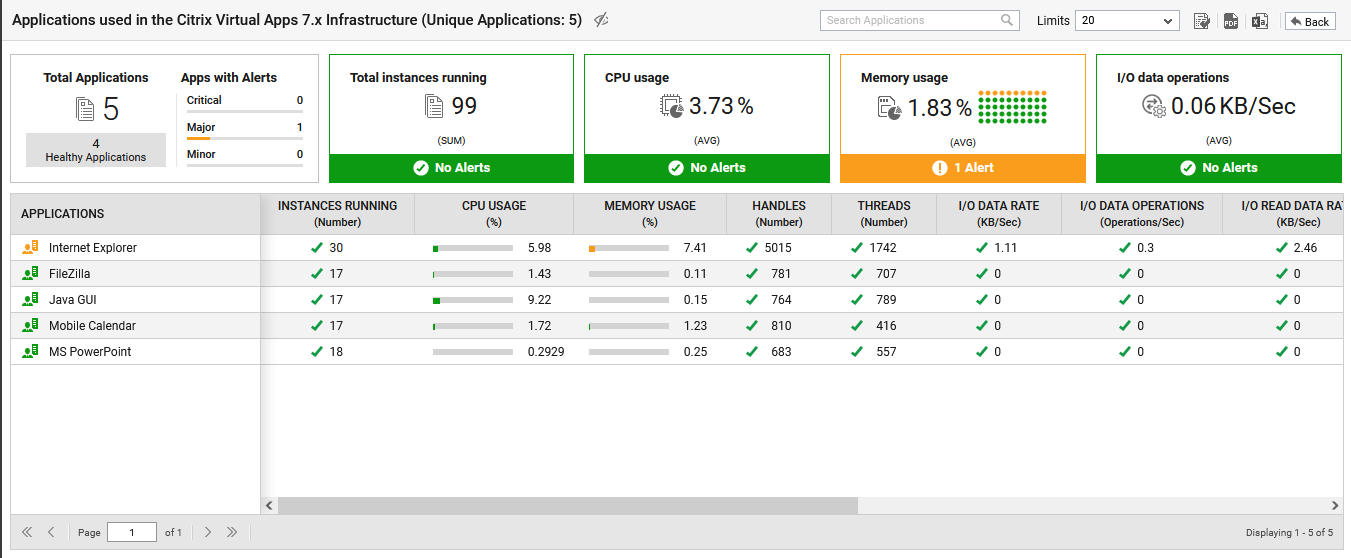
The total number applications that are currently running and active on the target Citrix server. Clicking on the value in this section will lead you to the Applications dashboard (see Figure 26).
-
The Launched Recently section displays the count of applications that are launched recently.
-
The Launch Time sections reveals the maximum and average time taken by the applications to launch. If any alerts were captured during application launch , then, the count of alerts will be displayed in this section. Clicking on the alerts section will invoke the App launch alerts window that displays all the individual alerts raised for the applications in the target environment.
-
The CPU usage section displays the overall percentage of CPU utilization by all the applications that are running on the target Citrix server. Clicking on the value in this section will lead you to the Applications dashboard (see Figure 26) where you can view the CPU utilization of each application. If any alerts were captured due to over-utilization of CPU resources, then, the count of alerts will be displayed in this section. Clicking on the alerts will invoke the CPU alerts window that displays all the alerts raised for the CPU usage of the applications.
-
The Memory usage section displays the overall percentage of memory utilization by all the applications that are running on the target Citrix server. Clicking on the value in this section will lead you to the Applications dashboard (see Figure 26) where you can view the memory utilization of each application. If any alerts were captured due to over-utilization of memory resources, then, the count of alerts will be displayed in this section. Clicking on the alerts will invoke the memory alerts window that displays all the alerts raised for the memory usage of the applications.
-
The IOPS section reveals the rate at which the read and write operations are performed by the applications that are running on the target server. Clicking on the value in this section will lead you to the Applications dashboard (see Figure 26) where you can view the rate at which the data read and write operations performed by each application. If any alerts were captured due to issues in the read and write operations, then, the count of alerts will be displayed in this section. Clicking on the alerts will invoke the iops alerts window that displays all the alerts raised for the issues in the read and write operations performed by the applications.
The By CPU and By Memory sections (Figure 27) of this page present the bar graphs that reveal the percentage of CPU and memory resources consumed by each application. If an application slowdown can be attributed to the lack of adequate CPU or memory resources, then these bar graphs can help you in quickly identifying the exact application that could be serving as the source of this CPU or memory contention. Clicking on each bar in these sections will lead you to the Applications dashboard (see Figure 26) where you can view the CPU and memory utilization of an individual application.
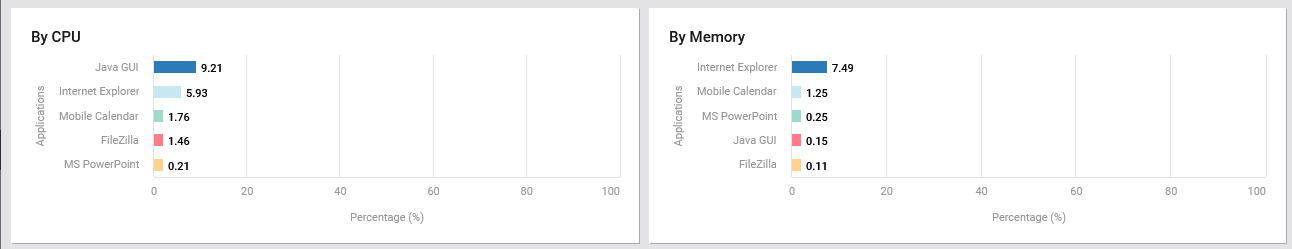
Figure 27 : The By CPU and By Memory sections of the Applications page
A bar graph in the By IOPS section reveals the rate at which each application processes the read and write operations. Clicking on each bar in this section will lead you to the Applications dashboard (see Figure 26) where you can view the number of read and write operations performed by each application per second. A bar graph in the By Instances section reveals the top-N applications based on the number of instances of those applications launched on the target server. Clicking on each bar in this section will lead you to the Applications dashboard (see Figure 26) where you can view the number of instances of each application that is running currently on the target server.
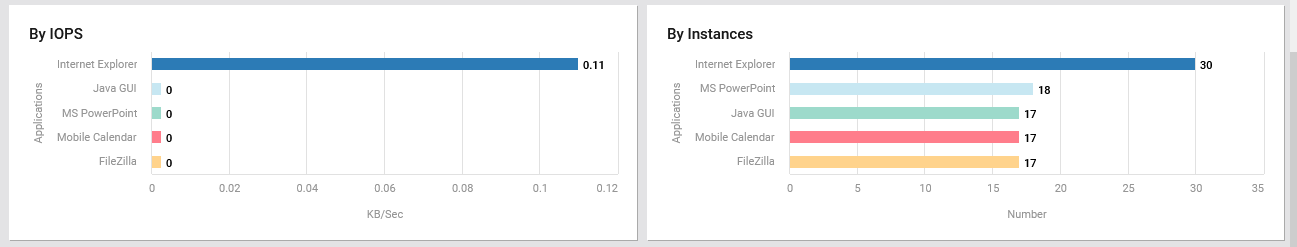
Figure 28 : The By IOPS and By Instances sections of the Applications page
By looking at a bar graph provided in the By Launch Time section (fig), administrators can easily identify the application that took longer time to launch. Clicking on each bar in this section will lead you to the Applications dashboard (see Figure 26). The By Handles section in Figure 29 provides a bar chart that reveals the applications with the maximum number of handles opened by the application processes that are running in the background.
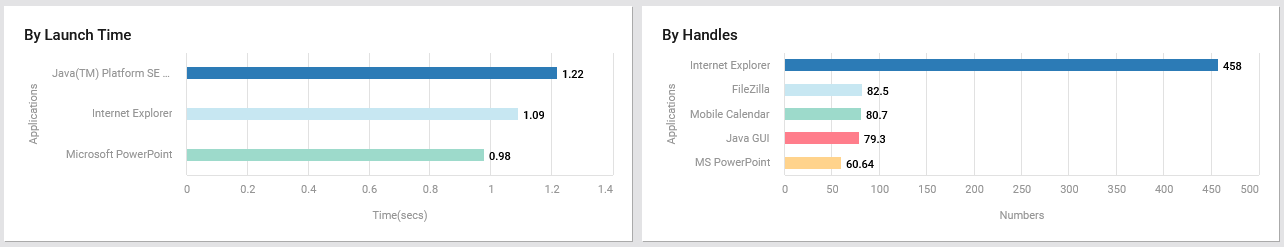
Figure 29 : The By Launch Time and By Handles sections of the Applications page
Next, the Open Application Alerts section (see Figure 30) lists the problems that are currently open for each application, the server on which the application is running, the time stamp at which the problem was reported and the end time.
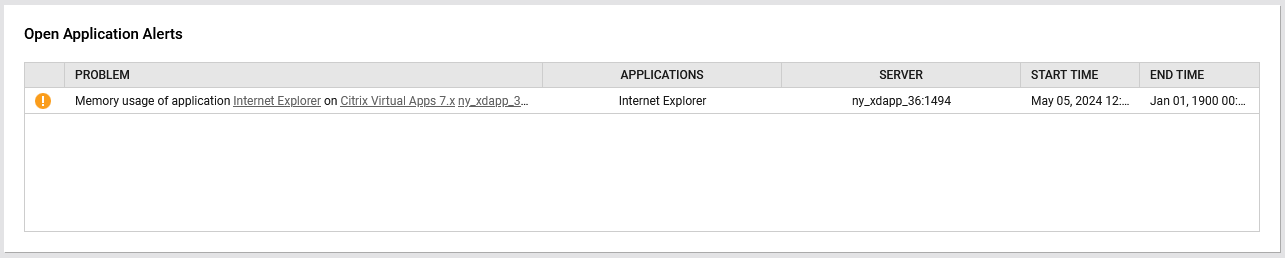
Figure 30 : The Open Application Alerts section of the Applications page
Resources
The Resources tab page appears when you click the Resources option from the left panel of the Virtual Apps dashboard. This dashboard provides insights into the CPU, memory and disk resources utilization and incoming and outgoing traffic at user, application and server levels.
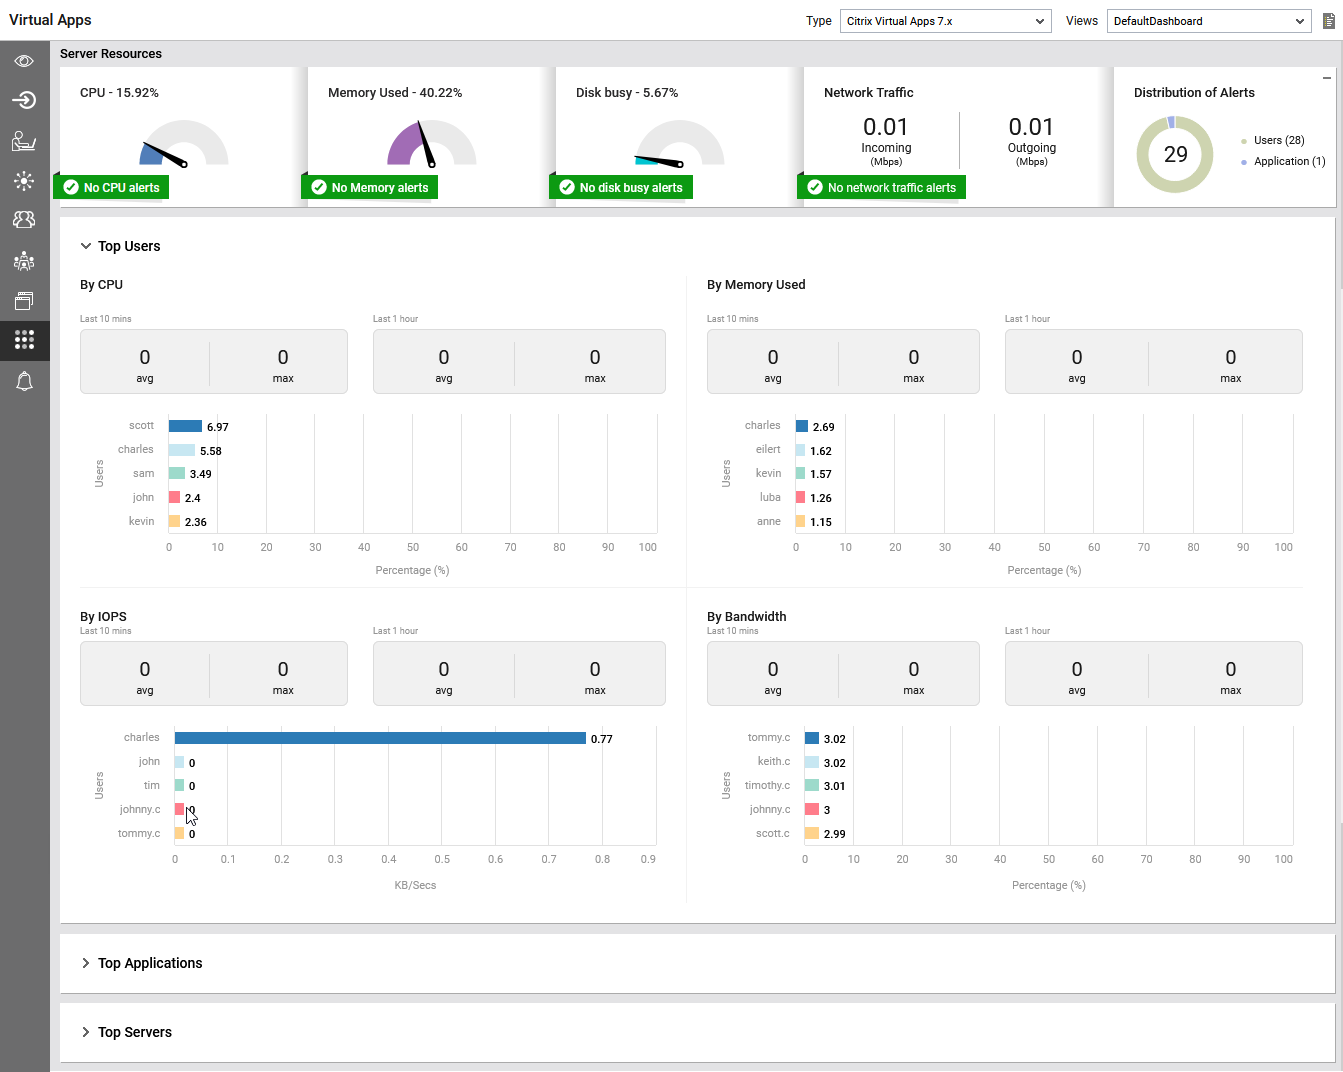
Figure 31 : The Virtual Apps - Resources dashboard
The top most ribbon in this dashboard helps administrators identify the following:
-
The CPU section displays a gauge chart that reveals the percentage of CPU utilized on the target server. If any alerts were captured due to over-utilization of CPU resources, then, the count of alerts will be displayed in this section. Clicking on the alerts will invoke the CPU alerts window that displays all the alerts raised for the CPU usage on the target server.
-
The gauge chart in the Memory Used section displays the overall percentage of memory utilization on the target server. If any alerts were captured due to over-utilization of memory resources, then, the count of alerts will be displayed in this section. Clicking on the alerts will invoke the memory alerts window that displays all the alerts raised for the memory usage on the server.
-
The gauge chart in the Disk busy section provides the percentage of elapsed time during which the disk is busy processing requests (i.e., reads or writes). If any alerts were captured due to issues in the disk while processing the requests, then, the count of alerts will be displayed in this section. Clicking on the alerts will invoke the Disk busy alerts window that displays all the alerts raised for disks on the target server.
-
The Network Traffic section reveals the rate at which the data is received and transmitted from the target server. If any alerts were captured while receiving and transmitting the requests, then, the count of alerts will be displayed in this section. Clicking on the alerts will invoke the network traffic alerts window that displays all the alerts raised for the problems encountered during data reception/transmission.
-
The Distribution of Alerts section provides a doughnut chart showing distribution of alerts that are currently open for the target server. Each slice of the doughnut chart represents the alerts raised for users and applications on the target server. Clicking on the legends provided in the section will lead you to the open problems window showing all the alerts that are currently open for the users/applications.
The Top Users section provides a series of bar charts based on the CPU usage, Memory usage, IOPS and bandwidth usage of the top-N users. Clicking on the bars provided in the bar charts will lead you to the User experience dashboard of the users.
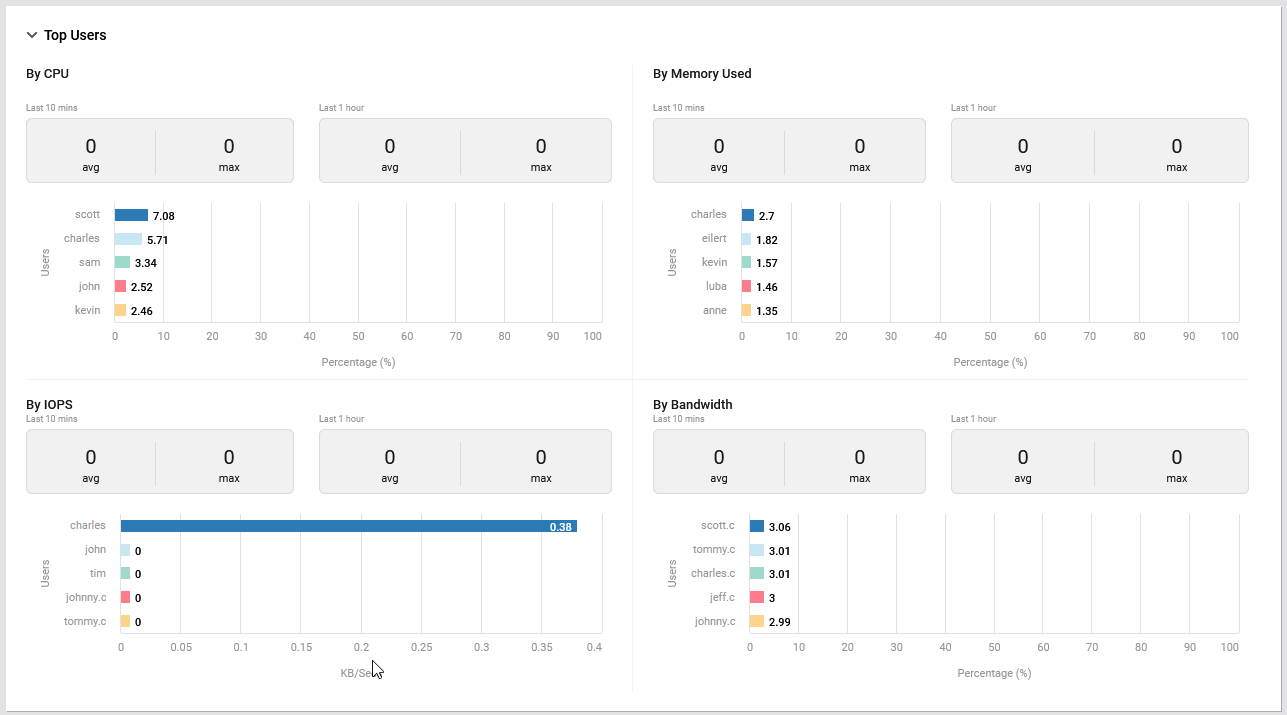
Figure 32 : The Top users section of the Resources tab page
By looking at these bar charts, you can also find out the average and maximum CPU and memory utilization by the users during the last 10 minutes that is displayed under the Last 10 mins field and during the last 1 hour that is displayed under the Last 1 hour field. Likewise, the average and maximum rates at which the read and write operations performed by the users during the last 10 minutes and last 1 hour are displayed under Last 10 mins and Last 1 hour fields, respectively. Furthermore, the average and maximum percentage of bandwidth used by the users during the last 10 minutes and last 1 hour are displayed under Last 10 mins and Last 1 hour fields, respectively.
The Top Applications section provides a series of bar charts based on the CPU usage and memory usage of the applications, the rate at which the read and write requests processed for the applications and the number of handles opened by the applications processes of the top-N applications. Clicking on the bars provided in the bar charts will lead you to the Applications dashboard.
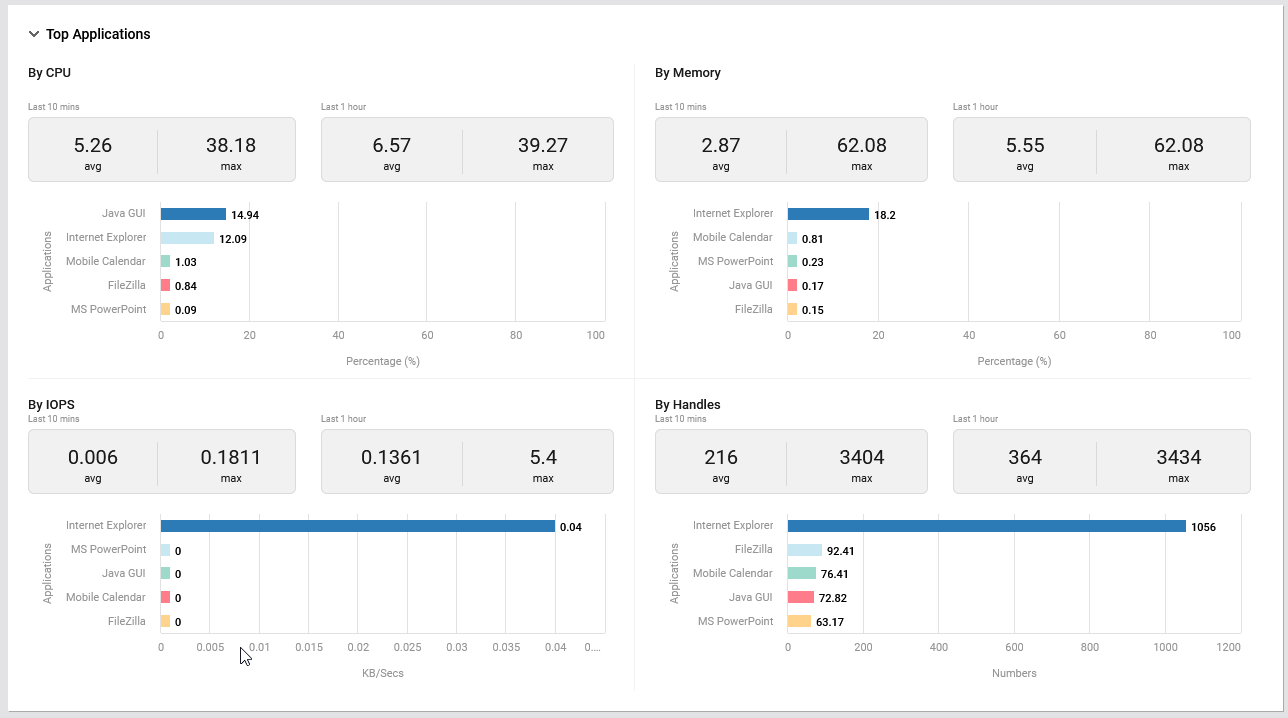
Figure 33 : The Top Applications section of the Resources tab page
By looking at these bar charts, you can also find out the average and maximum CPU and memory utilized by the applications during the last 10 minutes that is displayed under the Last 10 mins field and during the last 1 hour that is displayed under the Last 1 hour field. Likewise, the average and maximum rates at which the read and write operations are performed by the applications during the last 10 minutes and last 1 hour are displayed under Last 10 mins and Last 1 hour fields of the By IOPS section, respectively. Additionally, the average and maximum number of handles opened for the application processes running in the background during the last 10 minutes and last 1 hour are displayed under Last 10 mins and Last 1 hour fields of the By Handles section, respectively.
The Top Servers section provides a series of bar charts based on the CPU and memory utilization on the servers, incoming and outgoing traffic on the servers, and the how much the disks on the servers are busy in processing the requests. Clicking on the bars provided in the bar charts will lead you to the layer model page where the metrics related to the CPU and memory utilization, incoming/outgoing traffic and disk are recorded.
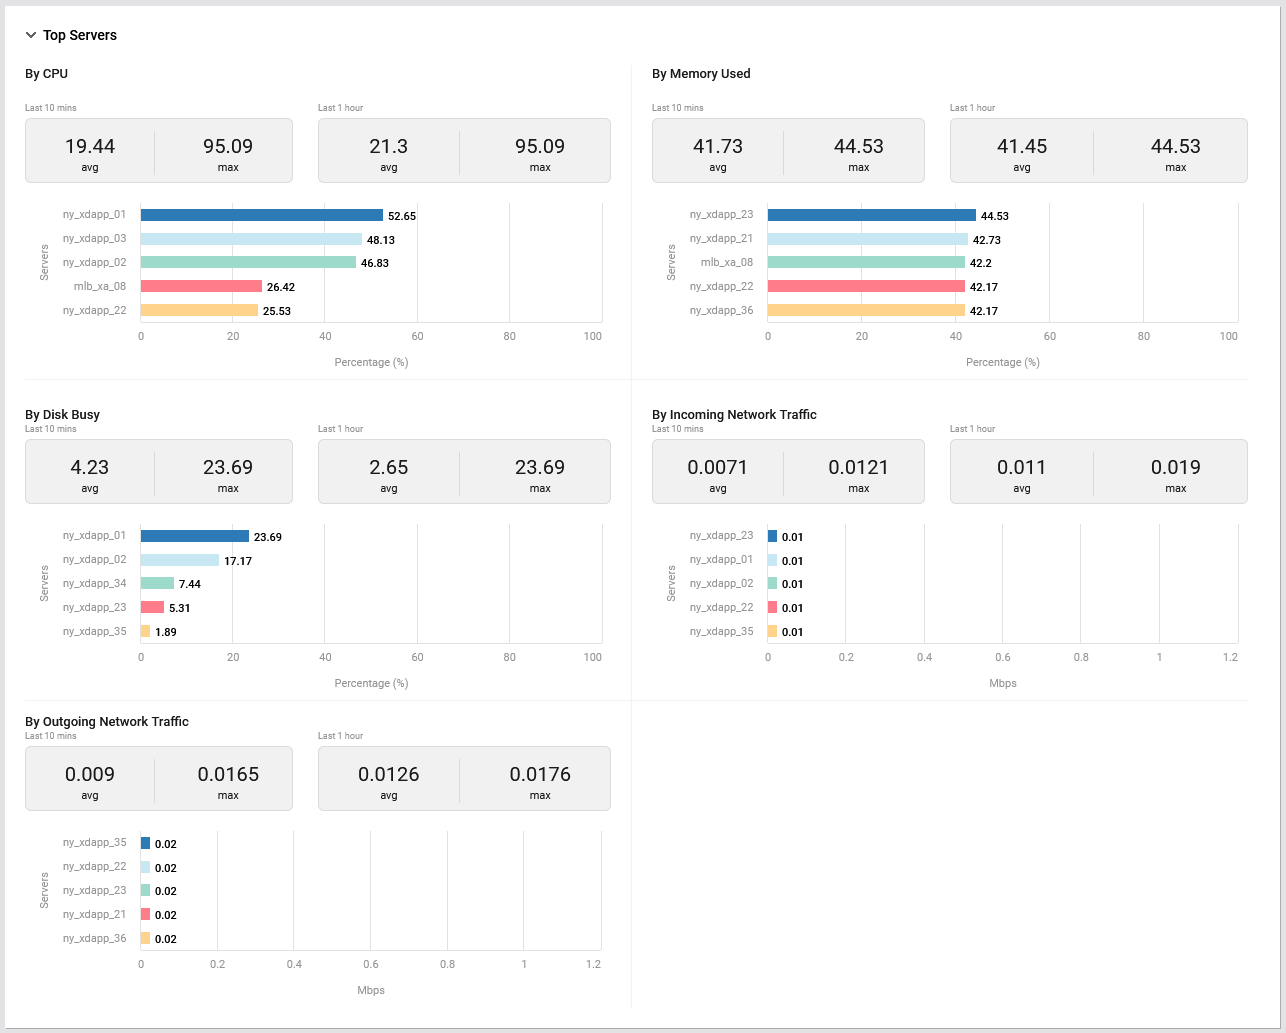
Figure 34 : The Top Applications section of the Resources tab page
By looking at these bar charts in the By CPU and By Memory used sections, you can find out the average and maximum CPU and memory resources utilized on the server during the last 10 minutes that is displayed under the Last 10 mins field and during the last 1 hour that is displayed under the Last 1 hour field. Likewise, the average and maximum percentage of elapsed time during which the disk was busy processing requests (i.e., reads or writes) during the last 10 minutes and last 1 hour are displayed under Last 10 mins and Last 1 hour fields of the By Disk Busy section, respectively. Additionally, the average and maximum rates at which the data was received by and transferred from the servers during the last 10 minutes and last 1 hour are displayed under Last 10 mins and Last 1 hour fields of the By Incoming Network traffic and By Outgoing Network Traffic sections, respectively.
Logon Activity
The Logon Activity page appears when you click the Logon option from the left panel of the Virtual Apps dashboard. This dashboard offers in-depth insights into the user logon activity, identify slow logons and isolate the users who experienced slowness while logging into the target Citrix Virtual Apps servers.
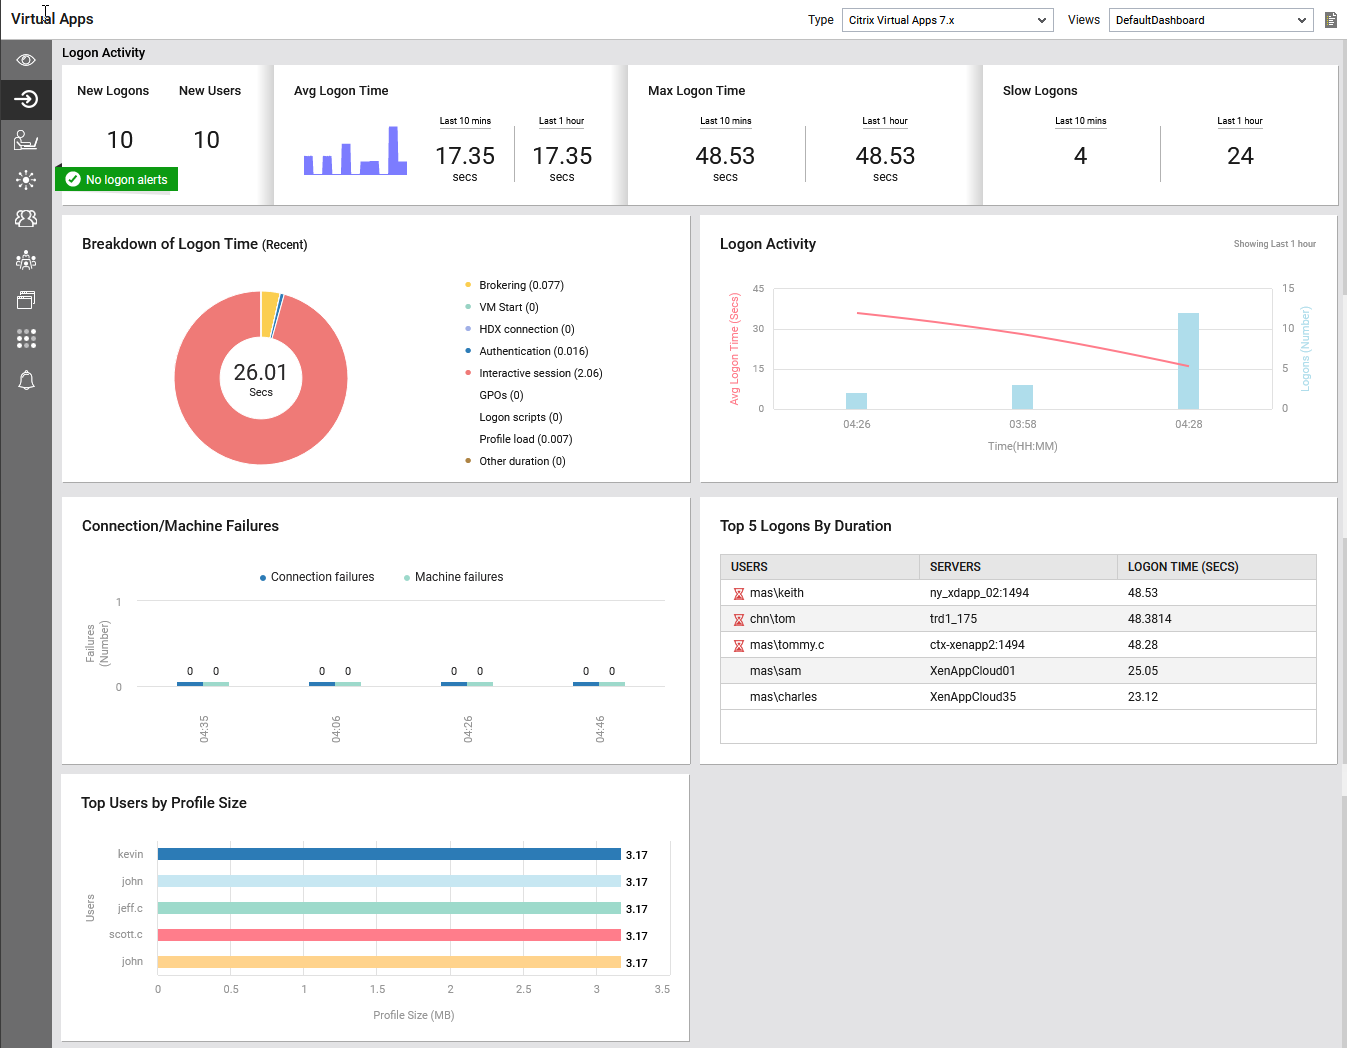
Figure 35 : The Virtual Apps - Logon Activity dashboard
The top most ribbon in this dashboard helps administrators identify the following:
-
The New Logons field displays the count of new logons that were captured recently and the New Users field displays the count of new users logged into the target Citrix Virtual Apps server. If any alerts were captured for user logons, then, the count of alerts will be displayed in this section. Clicking on the alerts section will lead you to the layer model of the target server on which users experienced logon issues.
-
The Avg Logon Time section displays a graph that helps administrators identify average time taken by the users to login into the target server during the past one hour. Clicking on the graph will lead you to the layer model page of the target Citrix server where average user logon duration is recorded. The average logon time (in seconds) taken by a user during the last 10 mins is displayed under the Last 10 mins field and the average logon time taken by a user during the last 1 hour is displayed under the Last 1 hour field. Clicking on a value against the Last 10 mins and Last 1 hour fields will lead you to the layer model page of the target Citrix server where average user logon duration is recorded.
-
In the Max Logon duration section, the maximum logon time (in seconds) taken by a user during the last 10 mins is displayed under the Last 10 mins field and the maximum logon time taken by a user during the last 1 hour is displayed under the Last 1 hour field. Clicking on a value displayed under the Last 10 mins and Last 1 hour field will lead you to the layer model page of the target Citrix server where you can identify the users who took the maximum time to login to the target Citrix server.
-
The Slow Logons section displays the number of user logins that were identified as slow during the Last 10 mins and Last 1 hour. Clicking on a value displayed under the Last 10 mins and Last 1 hour field will lead you to the layer model of the target Citrix server where you can identify the users whose logins to the Citrix server were identified as slow.
The Breakdown of Logon Time (Recent) section displays a doughnut chart which helps administrators visually identify the exact step that is causing logon slowness - is it GPOs? or User Profile? or Active Directory? or Logon script execution?
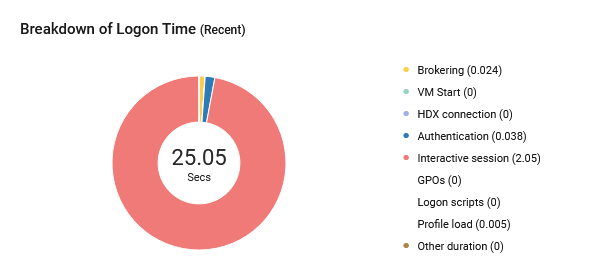
Figure 36 : The Breakdown of Logon Time section
Clicking on a legend displayed in this section will lead you to the User Experience Overview dashboard which helps administrators identify the users whose login experience is suffering.
The Logon Activity section displays a graph that shows the exact time at which the number of users logged in and the average time taken by the users to login during the last one hour. By merely looking at this graph, administrators can identify the exact time at which logins to the target server took too long and when exactly maximum number of users logged into the server.
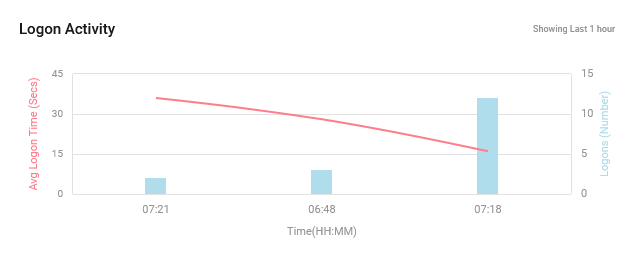
Figure 37 : The Logon Activity section
The Connection/Machine Failures section graphically displays the number of connections/machines that failed during the last one hour. By looking at this graph, administrators can instantly identify the exact time at which maximum number of connections/machines failed.
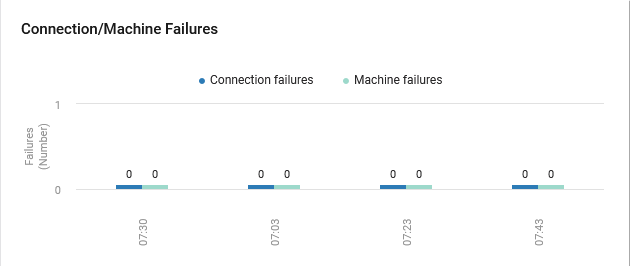
Figure 38 : The Connection/Machine Failures section
The Top 5 Logons By Duration section lists the top-N users in terms of the time taken by them to login to the virtual machines. This section helps the administrators quickly identify the users who took maximum time for logging in.

Figure 39 : The Top 5 Logons By Duration section
The Top Users By Profile Size section lists the top-N users based on their profile size. By merely looking at the bar graph provided in this section, administrators can identify the users with large profile size.
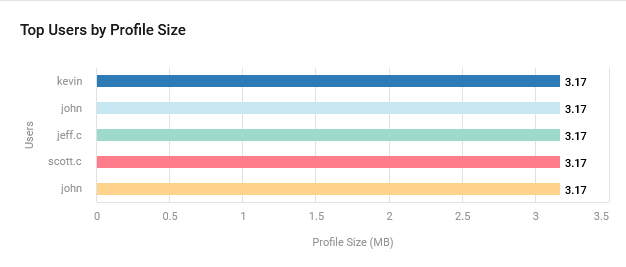
Figure 40 : The Top Users By Profile Size section
Alerts
The Alerts dashboard provides you with a consolidated list of alerts that are yet to be resolved across the Citrix Virtual Apps/Microsoft RDS/VMware RDS servers in the target environment. By default, the dashboard lists all the open eG alerts across all the Citrix Virtual Apps that have been managed in the target environment.
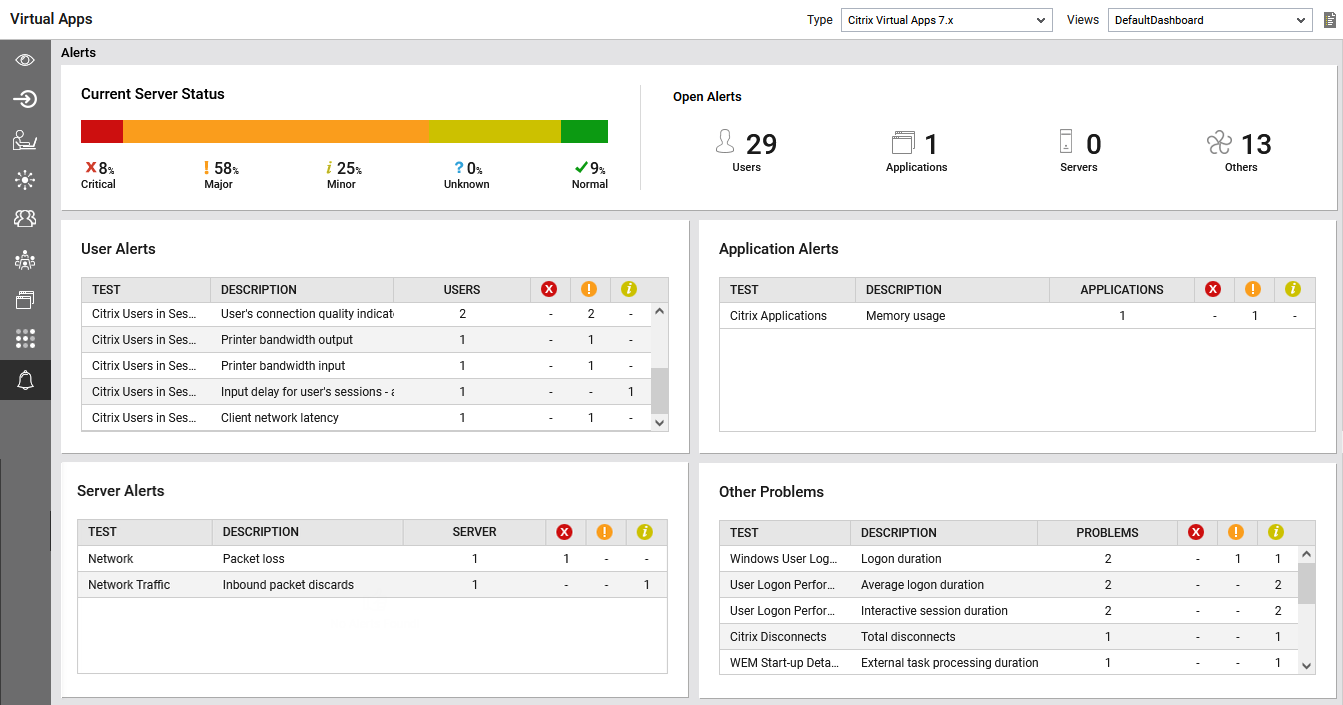
Figure 41 : The Virtual Apps - Alerts dashboard
The Current Server Status section in Figure 41reveals the health of the Citrix Virtual Apps components managed in the target environment. By viewing this section, administrators can figure out the percentage of Citrix Virtual Apps components that are problem-prone i.e., in Critical/Major/Minor states.
The Open Alerts section reveals the number of alerts that are currently open in the target environment for the managed Citrix Virtual Apps servers. The number of alerts displayed in the section are categorized based on the alerts related to each tier i.e., the Citrix Users, Citrix Applications and Citrix Servers. Also, this section reveals the count of alerts raised due to issues in operating system, network etc. under the Others category. Clicking on a number in this section will lead you to Figure 42 that lists all the open alerts relevant to that category.
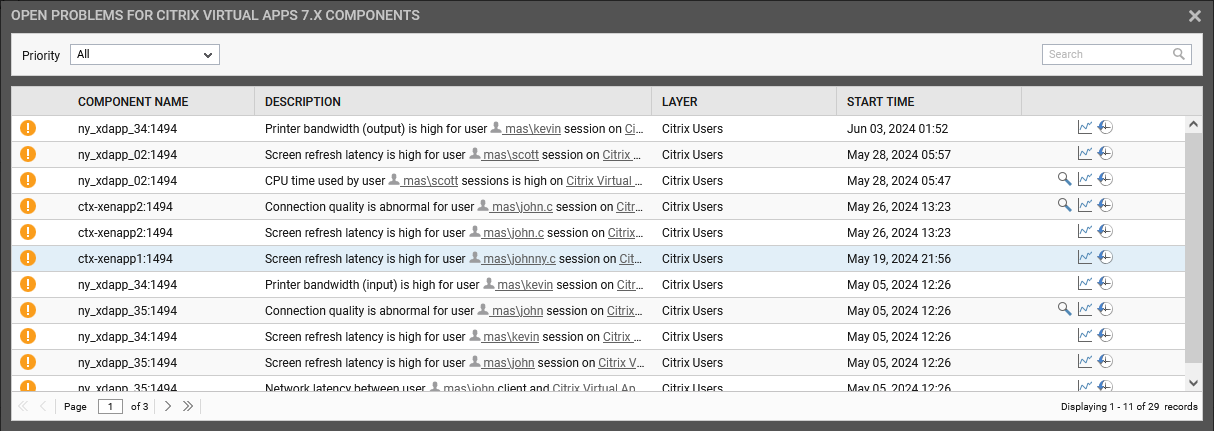
Figure 42 : Open Alerts for the Citrix Virtual Apps components
The User Alerts section offers detailed insights into where exactly the user experienced issues while accessing the target Citrix Virtual Apps server - is it during session start-up? or is it during user logins? or is it an issue with the user's browser? or is it while establishing sessions? etc. The User Alerts lists the exact test/measure combination that was responsible for an alert generated for users. Also, the count of Critical/Major/Minor alerts generated for the users are also reported for each test/measure combination. This will help administrators identify the exact issue and initiate troubleshooting at the earliest.
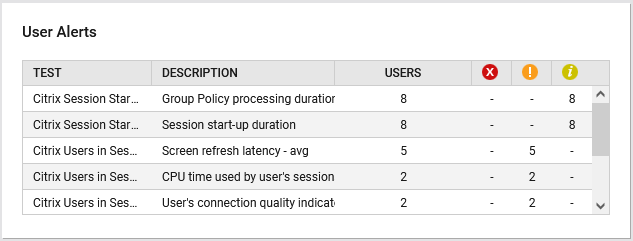
Figure 43 : The User Alerts section
Clicking on any column in a row will lead you to a pop up window with the heading of the measure responsible for the alert i.e., the measure displayed in the Description column. For example, if the Group Policy processing duration measure violated the threshold and resulted in an alert, then the GROUP POLICY PROCESSING DURATION pop up window will be opened as soon as you click the contents displayed in a row.
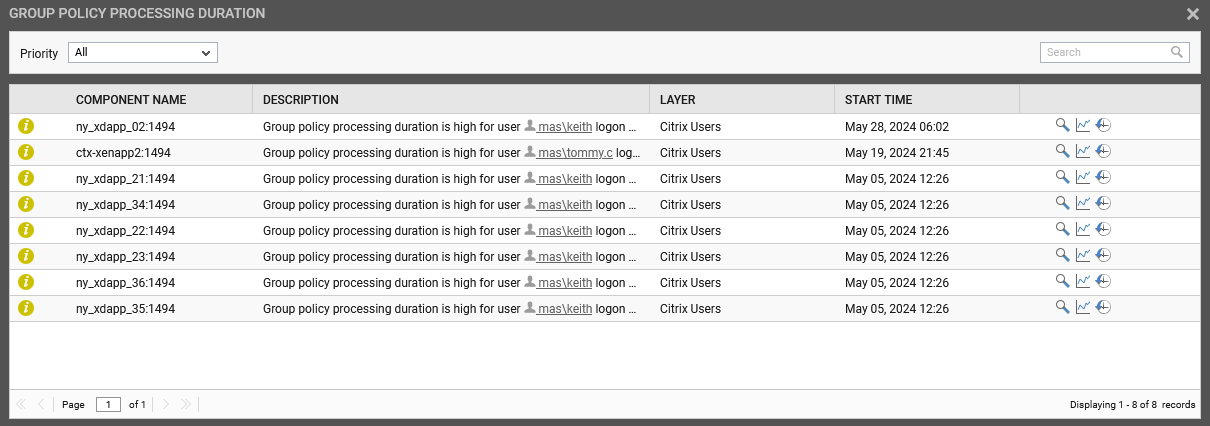
Figure 44 : The GROUP POLICY PROCESSING DURATION window
The Application Alerts section offers detailed insights into the applications that are problem-prone or slow to launch or could not be launched. The Application Alerts table lists the exact test/measure combination that was responsible for an alert that was generated while the application was launched/accessed. Also, the count of Critical/Major/Minor alerts generated while launching/accessing the applications are also reported for each test/measure combination. This will help administrators identify the exact issue and initiate troubleshooting at the earliest.
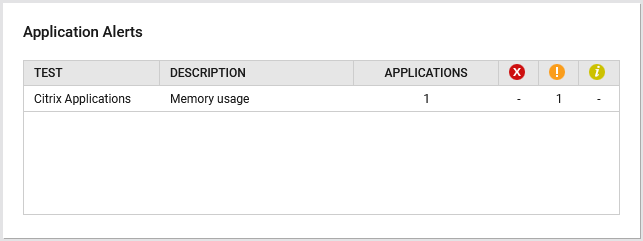
Figure 45 : The Application Alerts section
Clicking on any column in a row will lead you to a pop up window with the heading of the measure responsible for the alert i.e., the measure displayed in the Description column. For example, if the Memory Usage measure violated the threshold and resulted in an alert, then the MEMORY USAGE pop up window will be opened as soon as you click the contents displayed in a row.
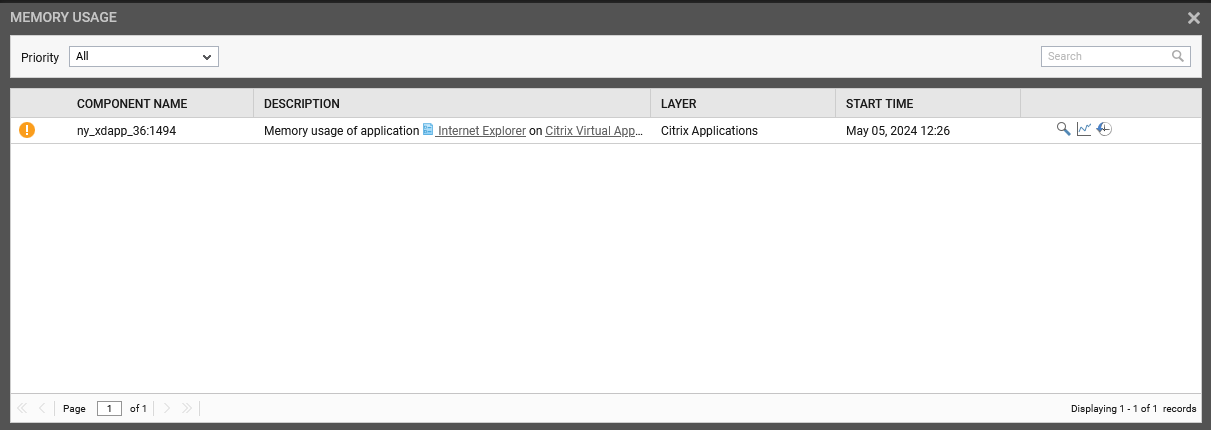
Figure 46 : The MEMORY USAGE window
The Server Alerts table offers detailed insights into the network related issues that are faced by users while accessing the Citrix Virtual Apps server. The Server Alerts table lists the exact test/measure combination that was responsible for the generation of alerts while the Citrix Virtual Apps server was accessed over the network. Also, the count of Critical/Major/Minor alerts generated while accessing the server are also reported for each test/measure combination. This will help administrators identify the exact issue and initiate troubleshooting at the earliest.
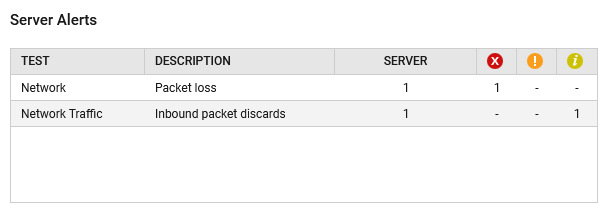
Figure 47 : The Server Alerts section
Clicking on any column in a row will lead you to a pop up window with the heading of the measure responsible for the alert i.e., the measure displayed in the Description column. For example, if the Packet Loss measure violated the threshold and resulted in an alert, then the Packet loss pop up window will be opened as soon as you click the contents displayed in a row.
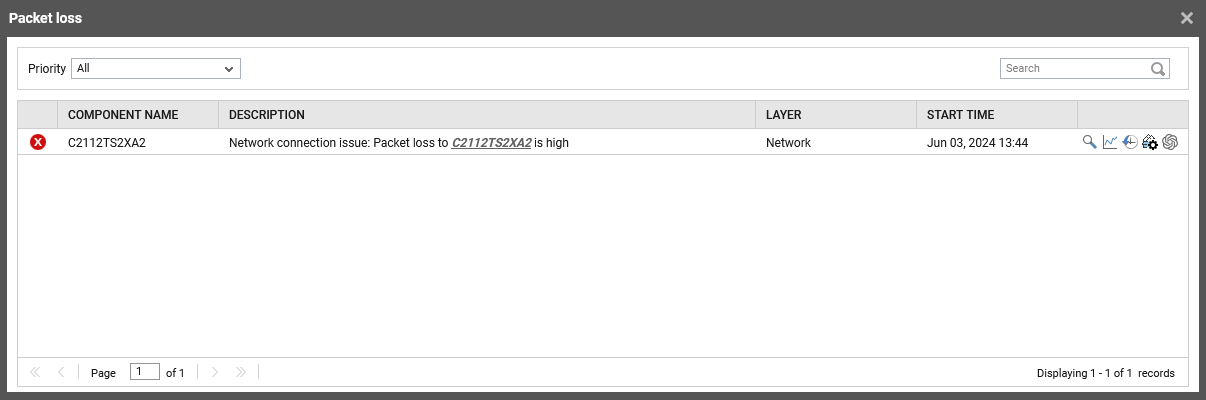
Figure 48 : The Packet loss window
The Other Problems section offers detailed insights into the common issues that are faced by users while accessing the Citrix Virtual Apps server. The Other Problems table lists the exact test/measure combination that was responsible for the generation of alerts while the Citrix Virtual Apps server was accessed by the users. Also, the count of Critical/Major/Minor alerts generated while accessing the server are also reported for each test/measure combination. This will help administrators identify the exact issue and initiate troubleshooting at the earliest.
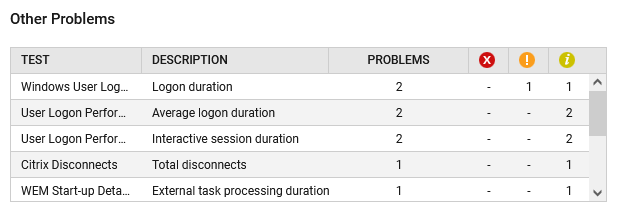
Figure 49 : The Other Problems section
Clicking on any column in a row will lead you to a pop up window with the heading of the measure responsible for the alert i.e., the measure displayed in the Description column. For example, if the Logon duration measure violated the threshold and resulted in an alert, then the LOGON DURATION pop up window (Figure 50) will be opened as soon as you click the contents displayed in a row.