The VC Tab Page
Promptly detect issues with vCenter and swiftly diagnose the root-cause of these issues, using the vc tab page offered by the VM dashboard. This tab page lists one/all vCenter servers in the environment (depending upon the node chosen from the tree), and reports the number of ESX servers managed, the resource usage, and the overall health of each vCenter server.
This section discusses how the contents of this tab page change with the node chosen from the tree.
-
If the global Zones node is chosen from the tree, then the vc tab page will display the names of all vCenter servers included in all configured zones, and will report a default set of metrics per vCenter server, revealing the availability and resource usage of each server. Resource-intensive/unavailable vCenter servers in the target environment can thus be instantly identified.
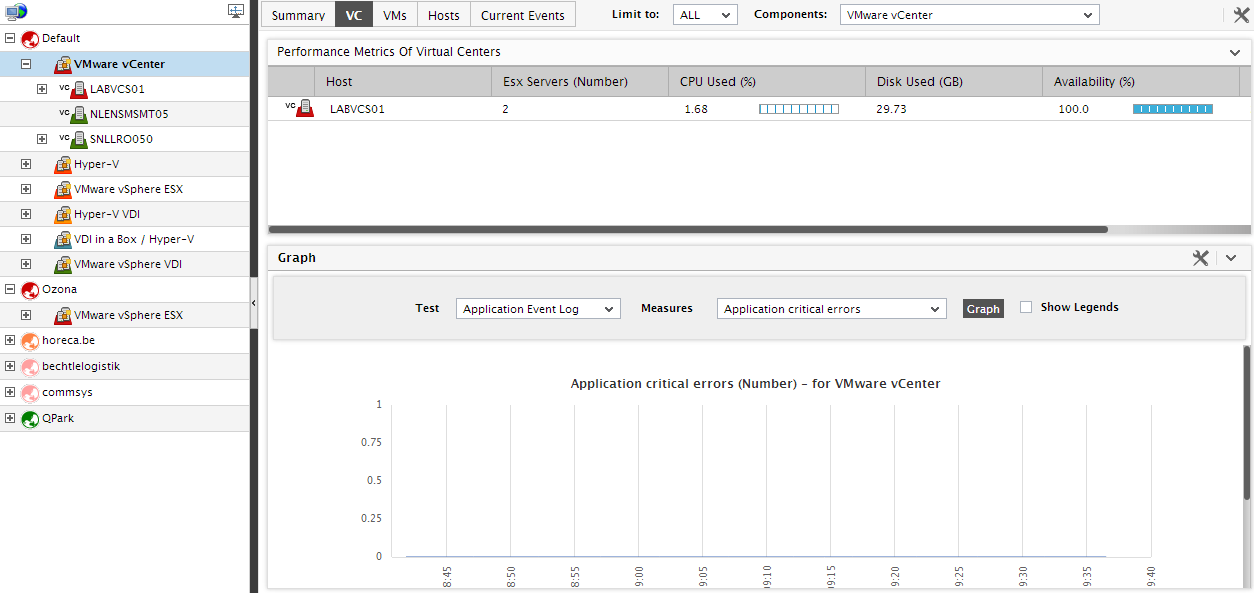
Figure 1 : The VC tab page if the global Zones node is clicked
-
The default measure list that accompanies every vCenter listed in the vc tab page can be modified. For this purpose, follow the steps given below:
-
Click on the
 button at the right, top corner of the tab page. Figure 2 will appear.
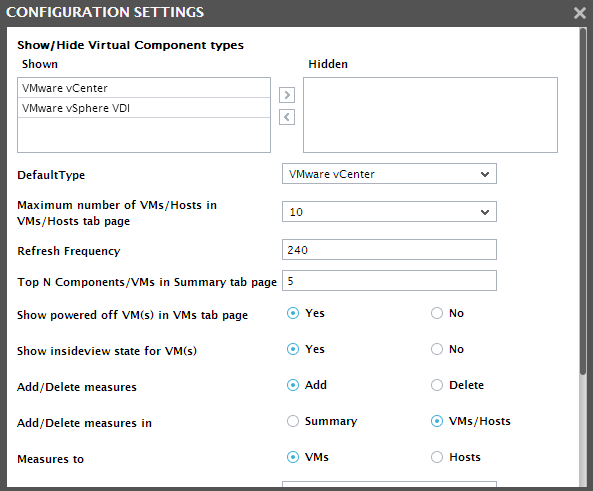
- Select Add from Add/Delete measures section to add a new measure to the vc tab page.
- Select VMs/Hosts from the Add/Delete measures in section in Figure 2.
- Set the Measures to flag to VMs.
- Then, set VMware vCenter as the Component type. Select the Test that reports the measure to be added, and then pick the Measure. Provide a Display Name for the new measure, and finally, click the Update button.
- To remove a measure that pre-exists in the vc tab page, select Delete from Add/Delete, select VM/Hosts from the Add/Delete measures in section, set the Measures to flag to VM, select the Component type, pick the Test, choose the Measure, and click the Update button.
-
-
In the event of a slowdown in the performance of a vCenter server, you can click on the name of that server in the vc tab page; this will lead you straight to the layer model of the vCenter server, which reveals the exact layer where the problem has originated. Click on the problem layer to view the problem test, and click on the problem test to view the measures (see Figure 3).
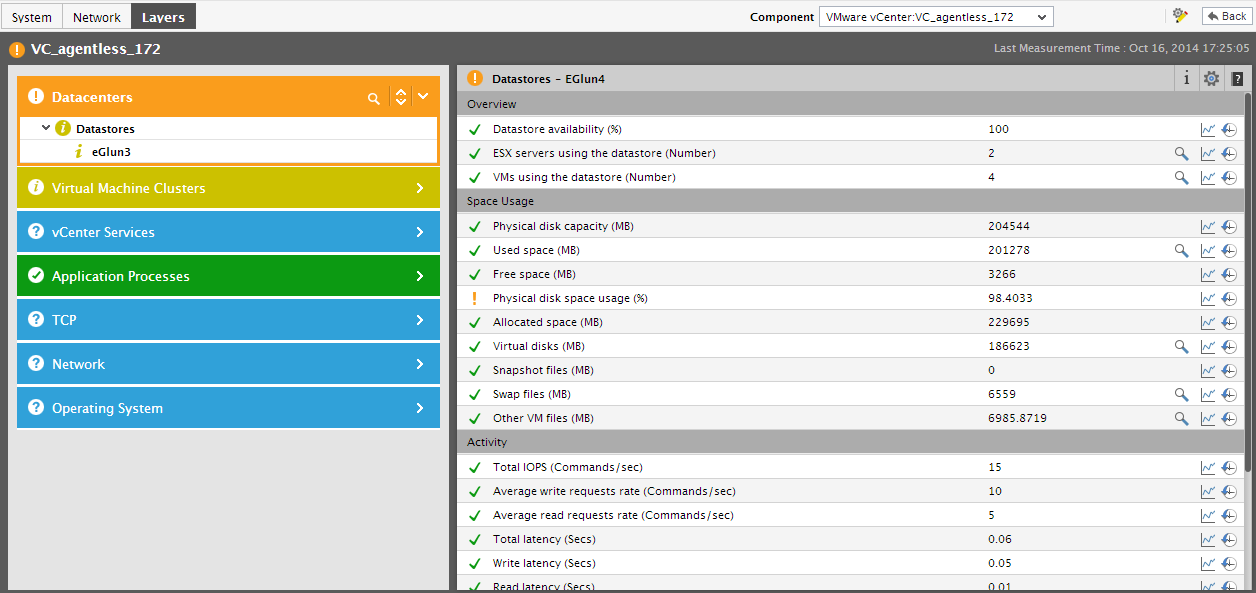
Figure 3 : The layer model, tests, and measures pertaining to the vCenter server
- The vc tab page also embeds a time-of-day graph, which, by default, reveals the variations in the number of VMs in each resource pool configured within each cluster on vCenter, during the last 1 hour. Accordingly, ClusterResourcePools is chosen by default from the Test list, the default Measure is VMs in pool, and the default Timeline is 1 hour. You can select a different Test and Measure combination for the graph, and also define a different Timeline for the graph, if required. Using this graph, you can efficiently analyze performance trends and proactively detect performance issues.
- To view the zones configured with one/more virtual component-types, expand the global Zones node in the tree. The individual zones will appear as sub-nodes of the global Zones node. Selecting a particular zone will reveal the performance details related to each vCenter server within that zone in the vc tab page.
-
Alternatively, you can select the VMware vCenter sub-node under a zone node to see how all the vCenter servers in a zone are performing (see Figure 4).
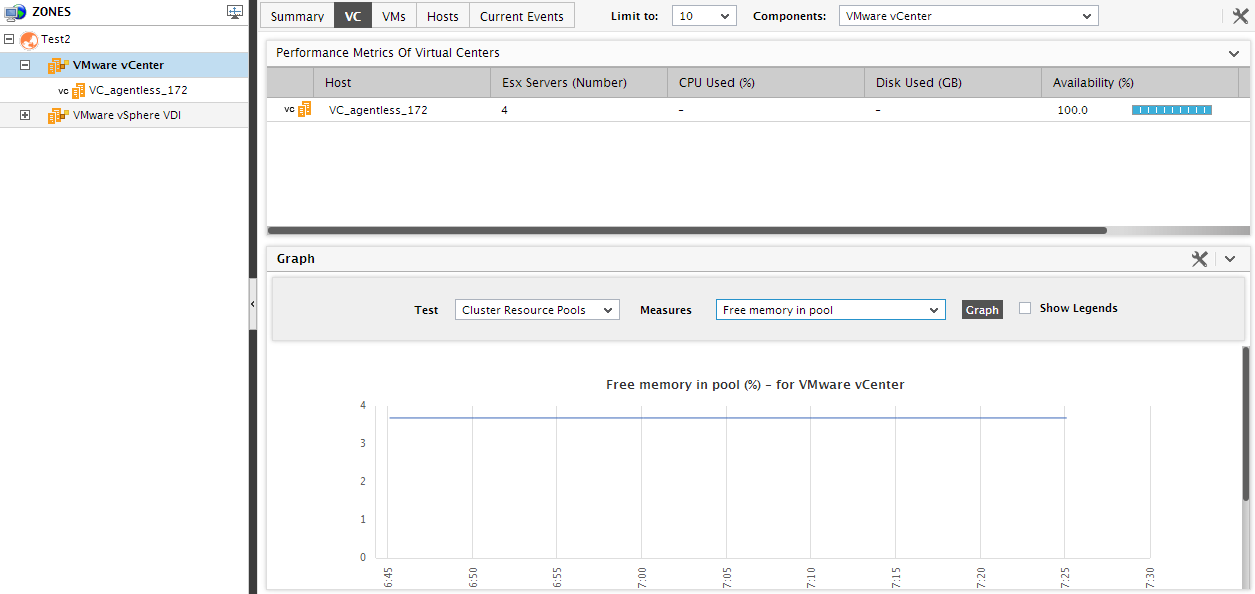
Figure 4 : The VC tab page if the ‘VMware vCenter’ node is chosen from the tree
-
If you want to check whether a particular vCenter server within a zone is available or not, and if available, how well its using the resources available to it, select the node representing a vCenter server under the VMware vCenter node in the tree structure (see Figure 5).
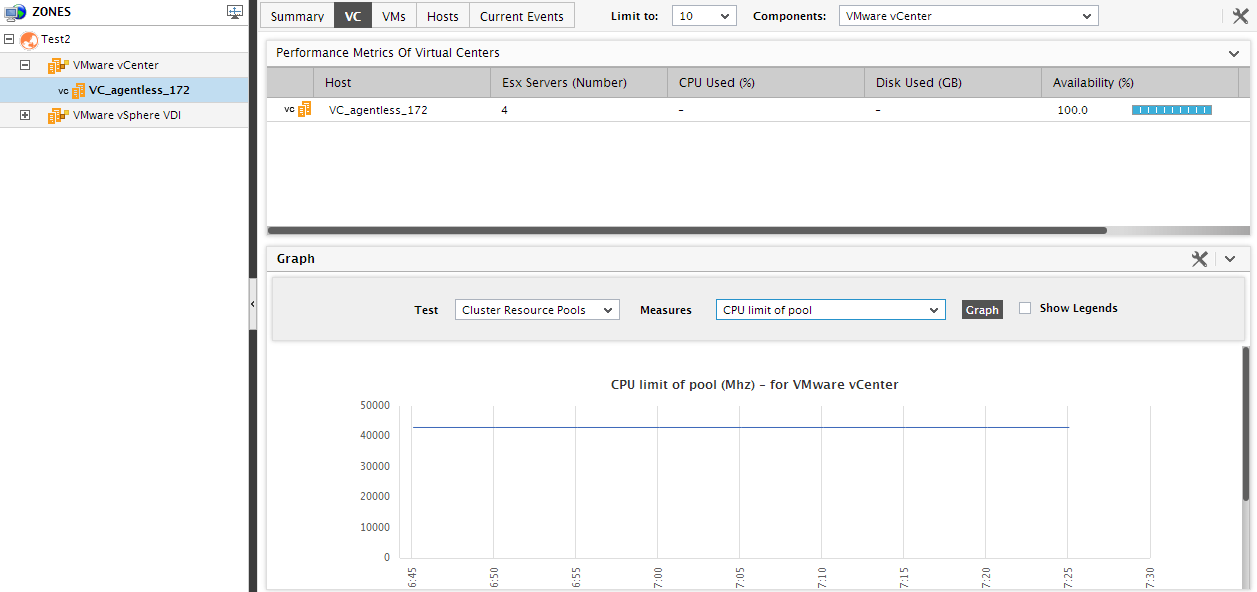
Figure 5 : The VC tab page for a particular vCenter server chosen from the tree